Immigrants from Latin America vs Immigrants from Peru 3 or more Vehicles in Household
COMPARE
Immigrants from Latin America
Immigrants from Peru
3 or more Vehicles in Household
3 or more Vehicles in Household Comparison
Immigrants from Latin America
Immigrants from Peru
20.5%
3 OR MORE VEHICLES IN HOUSEHOLD
94.5/ 100
METRIC RATING
119th/ 347
METRIC RANK
19.4%
3 OR MORE VEHICLES IN HOUSEHOLD
41.1/ 100
METRIC RATING
177th/ 347
METRIC RANK
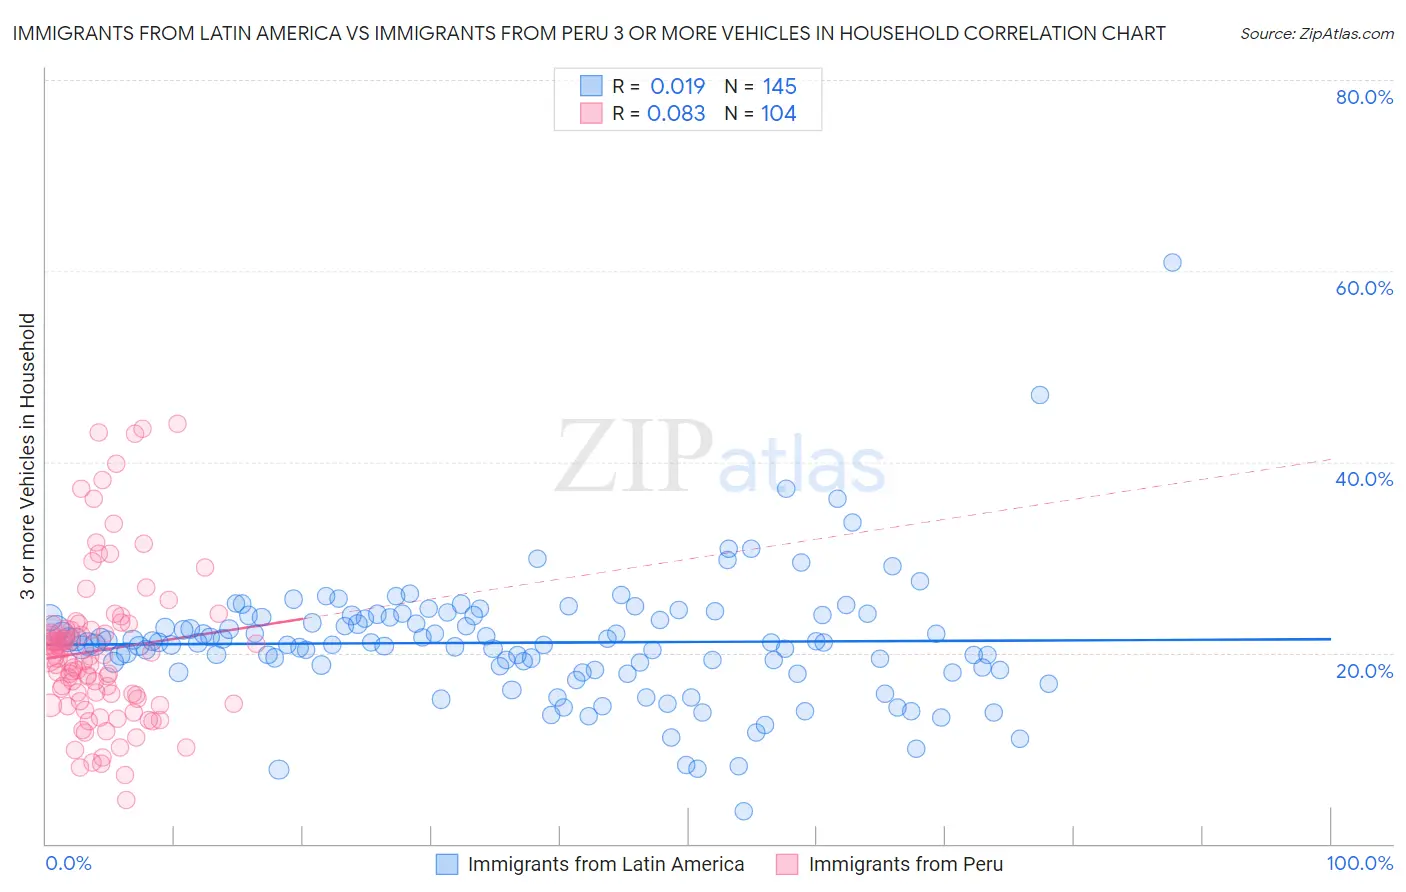
Immigrants from Latin America vs Immigrants from Peru 3 or more Vehicles in Household Correlation Chart
The statistical analysis conducted on geographies consisting of 557,725,170 people shows no correlation between the proportion of Immigrants from Latin America and percentage of households with 3 or more vehicles available in the United States with a correlation coefficient (R) of 0.019 and weighted average of 20.5%. Similarly, the statistical analysis conducted on geographies consisting of 328,696,716 people shows a slight positive correlation between the proportion of Immigrants from Peru and percentage of households with 3 or more vehicles available in the United States with a correlation coefficient (R) of 0.083 and weighted average of 19.4%, a difference of 6.1%.
3 or more Vehicles in Household Correlation Summary
| Measurement | Immigrants from Latin America | Immigrants from Peru |
| Minimum | 3.4% | 4.5% |
| Maximum | 60.9% | 44.1% |
| Range | 57.5% | 39.5% |
| Mean | 21.1% | 20.3% |
| Median | 21.0% | 19.5% |
| Interquartile 25% (IQ1) | 18.3% | 15.0% |
| Interquartile 75% (IQ3) | 23.8% | 22.7% |
| Interquartile Range (IQR) | 5.5% | 7.7% |
| Standard Deviation (Sample) | 6.6% | 8.1% |
| Standard Deviation (Population) | 6.6% | 8.1% |
Similar Demographics by 3 or more Vehicles in Household
Demographics Similar to Immigrants from Latin America by 3 or more Vehicles in Household
In terms of 3 or more vehicles in household, the demographic groups most similar to Immigrants from Latin America are Costa Rican (20.6%, a difference of 0.040%), Croatian (20.6%, a difference of 0.15%), Italian (20.6%, a difference of 0.17%), Maltese (20.5%, a difference of 0.19%), and French Canadian (20.6%, a difference of 0.20%).
| Demographics | Rating | Rank | 3 or more Vehicles in Household |
| Nicaraguans | 96.2 /100 | #112 | Exceptional 20.7% |
| Immigrants | England | 96.2 /100 | #113 | Exceptional 20.7% |
| Burmese | 95.8 /100 | #114 | Exceptional 20.6% |
| French Canadians | 95.0 /100 | #115 | Exceptional 20.6% |
| Italians | 94.9 /100 | #116 | Exceptional 20.6% |
| Croatians | 94.9 /100 | #117 | Exceptional 20.6% |
| Costa Ricans | 94.6 /100 | #118 | Exceptional 20.6% |
| Immigrants | Latin America | 94.5 /100 | #119 | Exceptional 20.5% |
| Maltese | 93.9 /100 | #120 | Exceptional 20.5% |
| Immigrants | Thailand | 93.8 /100 | #121 | Exceptional 20.5% |
| German Russians | 93.7 /100 | #122 | Exceptional 20.5% |
| Immigrants | Korea | 93.7 /100 | #123 | Exceptional 20.5% |
| Central Americans | 93.1 /100 | #124 | Exceptional 20.5% |
| Immigrants | Netherlands | 92.9 /100 | #125 | Exceptional 20.4% |
| Slavs | 92.1 /100 | #126 | Exceptional 20.4% |
Demographics Similar to Immigrants from Peru by 3 or more Vehicles in Household
In terms of 3 or more vehicles in household, the demographic groups most similar to Immigrants from Peru are Immigrants from Syria (19.4%, a difference of 0.070%), Immigrants from South Central Asia (19.3%, a difference of 0.17%), South African (19.3%, a difference of 0.29%), Romanian (19.3%, a difference of 0.32%), and Cuban (19.3%, a difference of 0.36%).
| Demographics | Rating | Rank | 3 or more Vehicles in Household |
| Iraqis | 56.0 /100 | #170 | Average 19.6% |
| Immigrants | Western Europe | 53.2 /100 | #171 | Average 19.5% |
| Kiowa | 50.9 /100 | #172 | Average 19.5% |
| Immigrants | Northern Europe | 50.2 /100 | #173 | Average 19.5% |
| Immigrants | South Africa | 50.0 /100 | #174 | Average 19.5% |
| Syrians | 47.0 /100 | #175 | Average 19.5% |
| Iroquois | 46.0 /100 | #176 | Average 19.4% |
| Immigrants | Peru | 41.1 /100 | #177 | Average 19.4% |
| Immigrants | Syria | 40.3 /100 | #178 | Average 19.4% |
| Immigrants | South Central Asia | 38.9 /100 | #179 | Fair 19.3% |
| South Africans | 37.5 /100 | #180 | Fair 19.3% |
| Romanians | 37.1 /100 | #181 | Fair 19.3% |
| Cubans | 36.6 /100 | #182 | Fair 19.3% |
| Cajuns | 36.0 /100 | #183 | Fair 19.3% |
| Latvians | 35.7 /100 | #184 | Fair 19.3% |