Immigrants from Latin America vs Vietnamese 3 or more Vehicles in Household
COMPARE
Immigrants from Latin America
Vietnamese
3 or more Vehicles in Household
3 or more Vehicles in Household Comparison
Immigrants from Latin America
Vietnamese
20.5%
3 OR MORE VEHICLES IN HOUSEHOLD
94.5/ 100
METRIC RATING
119th/ 347
METRIC RANK
12.5%
3 OR MORE VEHICLES IN HOUSEHOLD
0.0/ 100
METRIC RATING
338th/ 347
METRIC RANK
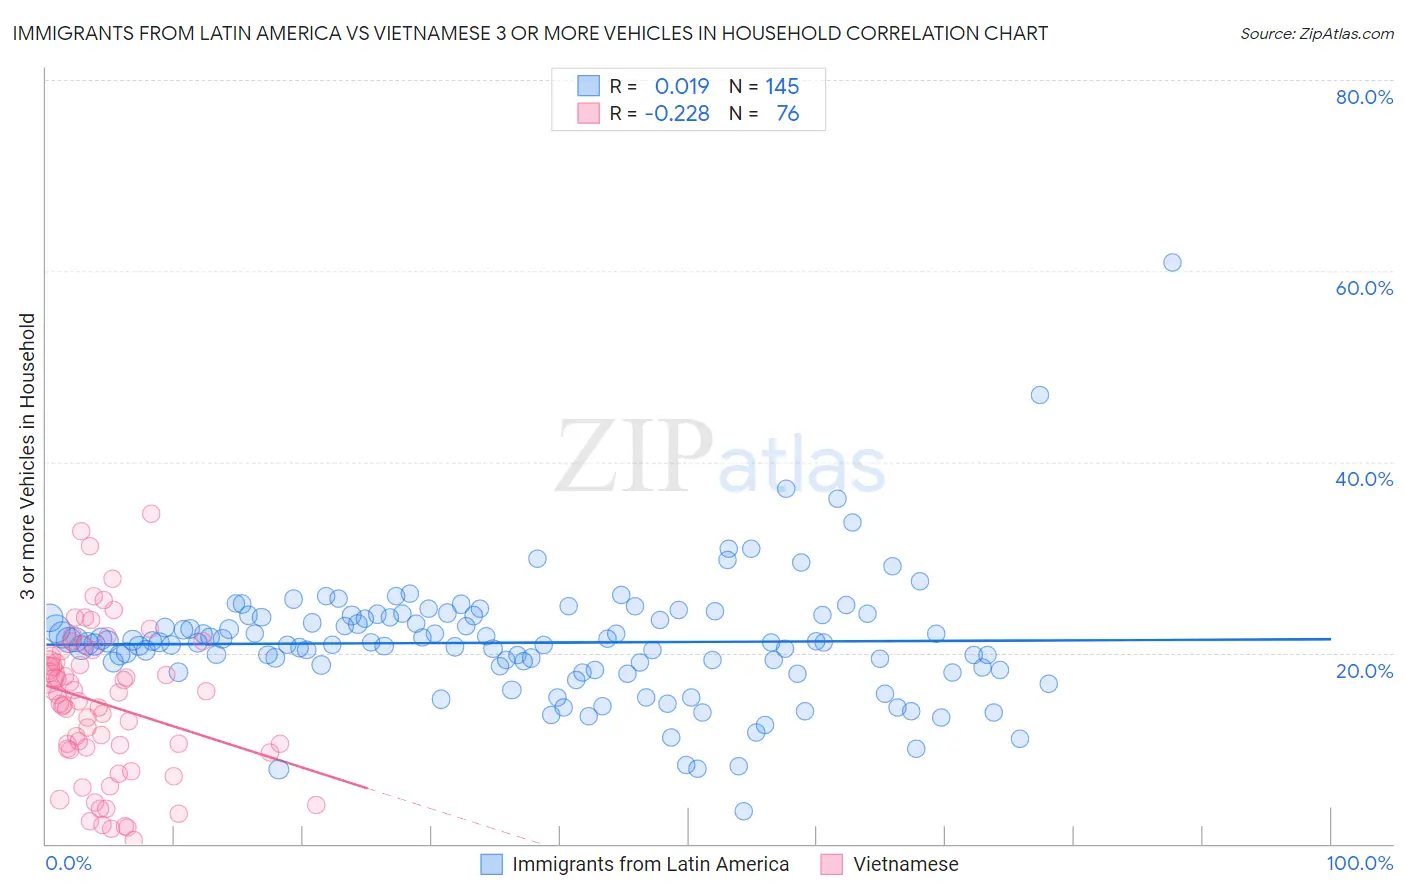
Immigrants from Latin America vs Vietnamese 3 or more Vehicles in Household Correlation Chart
The statistical analysis conducted on geographies consisting of 557,725,170 people shows no correlation between the proportion of Immigrants from Latin America and percentage of households with 3 or more vehicles available in the United States with a correlation coefficient (R) of 0.019 and weighted average of 20.5%. Similarly, the statistical analysis conducted on geographies consisting of 170,612,535 people shows a weak negative correlation between the proportion of Vietnamese and percentage of households with 3 or more vehicles available in the United States with a correlation coefficient (R) of -0.228 and weighted average of 12.5%, a difference of 65.0%.
3 or more Vehicles in Household Correlation Summary
| Measurement | Immigrants from Latin America | Vietnamese |
| Minimum | 3.4% | 0.43% |
| Maximum | 60.9% | 34.6% |
| Range | 57.5% | 34.1% |
| Mean | 21.1% | 14.7% |
| Median | 21.0% | 15.2% |
| Interquartile 25% (IQ1) | 18.3% | 9.9% |
| Interquartile 75% (IQ3) | 23.8% | 19.4% |
| Interquartile Range (IQR) | 5.5% | 9.6% |
| Standard Deviation (Sample) | 6.6% | 7.8% |
| Standard Deviation (Population) | 6.6% | 7.7% |
Similar Demographics by 3 or more Vehicles in Household
Demographics Similar to Immigrants from Latin America by 3 or more Vehicles in Household
In terms of 3 or more vehicles in household, the demographic groups most similar to Immigrants from Latin America are Costa Rican (20.6%, a difference of 0.040%), Croatian (20.6%, a difference of 0.15%), Italian (20.6%, a difference of 0.17%), Maltese (20.5%, a difference of 0.19%), and French Canadian (20.6%, a difference of 0.20%).
| Demographics | Rating | Rank | 3 or more Vehicles in Household |
| Nicaraguans | 96.2 /100 | #112 | Exceptional 20.7% |
| Immigrants | England | 96.2 /100 | #113 | Exceptional 20.7% |
| Burmese | 95.8 /100 | #114 | Exceptional 20.6% |
| French Canadians | 95.0 /100 | #115 | Exceptional 20.6% |
| Italians | 94.9 /100 | #116 | Exceptional 20.6% |
| Croatians | 94.9 /100 | #117 | Exceptional 20.6% |
| Costa Ricans | 94.6 /100 | #118 | Exceptional 20.6% |
| Immigrants | Latin America | 94.5 /100 | #119 | Exceptional 20.5% |
| Maltese | 93.9 /100 | #120 | Exceptional 20.5% |
| Immigrants | Thailand | 93.8 /100 | #121 | Exceptional 20.5% |
| German Russians | 93.7 /100 | #122 | Exceptional 20.5% |
| Immigrants | Korea | 93.7 /100 | #123 | Exceptional 20.5% |
| Central Americans | 93.1 /100 | #124 | Exceptional 20.5% |
| Immigrants | Netherlands | 92.9 /100 | #125 | Exceptional 20.4% |
| Slavs | 92.1 /100 | #126 | Exceptional 20.4% |
Demographics Similar to Vietnamese by 3 or more Vehicles in Household
In terms of 3 or more vehicles in household, the demographic groups most similar to Vietnamese are Immigrants from Bangladesh (12.5%, a difference of 0.54%), Barbadian (12.6%, a difference of 0.98%), Immigrants from Uzbekistan (12.0%, a difference of 3.9%), Immigrants from Barbados (11.7%, a difference of 6.2%), and Immigrants from Trinidad and Tobago (13.3%, a difference of 7.1%).
| Demographics | Rating | Rank | 3 or more Vehicles in Household |
| Immigrants | Dominica | 0.0 /100 | #331 | Tragic 13.7% |
| Trinidadians and Tobagonians | 0.0 /100 | #332 | Tragic 13.6% |
| Immigrants | Cabo Verde | 0.0 /100 | #333 | Tragic 13.6% |
| Immigrants | Ecuador | 0.0 /100 | #334 | Tragic 13.4% |
| Immigrants | Trinidad and Tobago | 0.0 /100 | #335 | Tragic 13.3% |
| Barbadians | 0.0 /100 | #336 | Tragic 12.6% |
| Immigrants | Bangladesh | 0.0 /100 | #337 | Tragic 12.5% |
| Vietnamese | 0.0 /100 | #338 | Tragic 12.5% |
| Immigrants | Uzbekistan | 0.0 /100 | #339 | Tragic 12.0% |
| Immigrants | Barbados | 0.0 /100 | #340 | Tragic 11.7% |
| Guyanese | 0.0 /100 | #341 | Tragic 11.5% |
| British West Indians | 0.0 /100 | #342 | Tragic 11.4% |
| Immigrants | Guyana | 0.0 /100 | #343 | Tragic 11.2% |
| Dominicans | 0.0 /100 | #344 | Tragic 11.2% |
| Immigrants | Dominican Republic | 0.0 /100 | #345 | Tragic 10.4% |