Puerto Rican vs Jordanian 3 or more Vehicles in Household
COMPARE
Puerto Rican
Jordanian
3 or more Vehicles in Household
3 or more Vehicles in Household Comparison
Puerto Ricans
Jordanians
15.6%
3 OR MORE VEHICLES IN HOUSEHOLD
0.0/ 100
METRIC RATING
312th/ 347
METRIC RANK
20.1%
3 OR MORE VEHICLES IN HOUSEHOLD
84.4/ 100
METRIC RATING
142nd/ 347
METRIC RANK
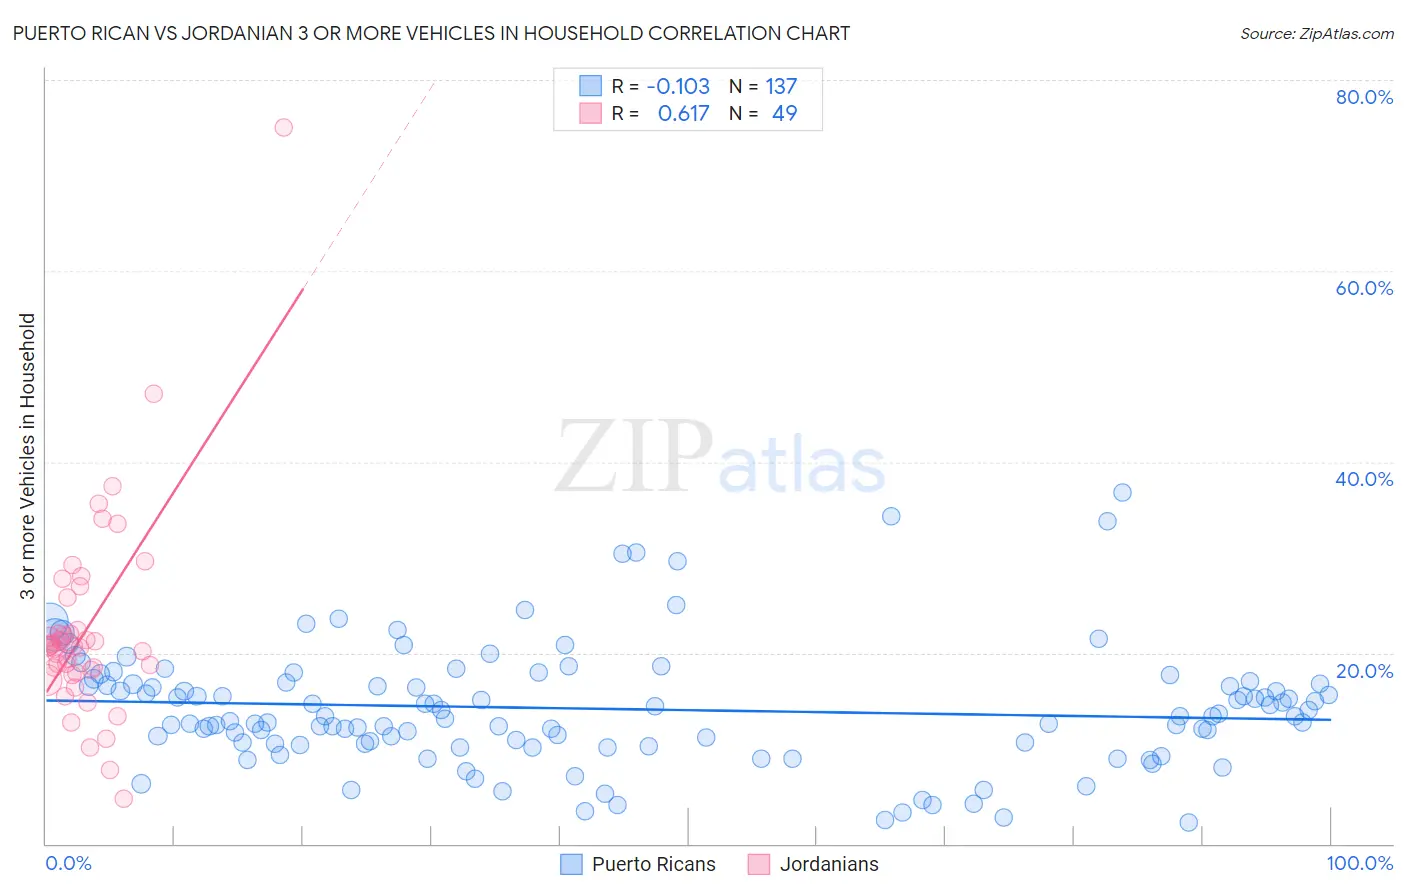
Puerto Rican vs Jordanian 3 or more Vehicles in Household Correlation Chart
The statistical analysis conducted on geographies consisting of 527,466,377 people shows a poor negative correlation between the proportion of Puerto Ricans and percentage of households with 3 or more vehicles available in the United States with a correlation coefficient (R) of -0.103 and weighted average of 15.6%. Similarly, the statistical analysis conducted on geographies consisting of 166,358,031 people shows a significant positive correlation between the proportion of Jordanians and percentage of households with 3 or more vehicles available in the United States with a correlation coefficient (R) of 0.617 and weighted average of 20.1%, a difference of 28.8%.
3 or more Vehicles in Household Correlation Summary
| Measurement | Puerto Rican | Jordanian |
| Minimum | 2.3% | 4.7% |
| Maximum | 36.7% | 75.0% |
| Range | 34.5% | 70.3% |
| Mean | 14.1% | 22.4% |
| Median | 13.4% | 20.7% |
| Interquartile 25% (IQ1) | 10.5% | 18.0% |
| Interquartile 75% (IQ3) | 16.8% | 24.1% |
| Interquartile Range (IQR) | 6.4% | 6.0% |
| Standard Deviation (Sample) | 6.3% | 10.8% |
| Standard Deviation (Population) | 6.3% | 10.7% |
Similar Demographics by 3 or more Vehicles in Household
Demographics Similar to Puerto Ricans by 3 or more Vehicles in Household
In terms of 3 or more vehicles in household, the demographic groups most similar to Puerto Ricans are Immigrants from Israel (15.6%, a difference of 0.020%), Immigrants from Belarus (15.5%, a difference of 0.66%), Haitian (15.5%, a difference of 0.98%), Albanian (15.8%, a difference of 1.1%), and U.S. Virgin Islander (15.4%, a difference of 1.5%).
| Demographics | Rating | Rank | 3 or more Vehicles in Household |
| Immigrants | Morocco | 0.0 /100 | #305 | Tragic 16.3% |
| Somalis | 0.0 /100 | #306 | Tragic 16.2% |
| Immigrants | Ghana | 0.0 /100 | #307 | Tragic 16.2% |
| Houma | 0.0 /100 | #308 | Tragic 16.1% |
| Immigrants | Somalia | 0.0 /100 | #309 | Tragic 15.9% |
| Moroccans | 0.0 /100 | #310 | Tragic 15.9% |
| Albanians | 0.0 /100 | #311 | Tragic 15.8% |
| Puerto Ricans | 0.0 /100 | #312 | Tragic 15.6% |
| Immigrants | Israel | 0.0 /100 | #313 | Tragic 15.6% |
| Immigrants | Belarus | 0.0 /100 | #314 | Tragic 15.5% |
| Haitians | 0.0 /100 | #315 | Tragic 15.5% |
| U.S. Virgin Islanders | 0.0 /100 | #316 | Tragic 15.4% |
| Jamaicans | 0.0 /100 | #317 | Tragic 15.2% |
| Immigrants | Haiti | 0.0 /100 | #318 | Tragic 15.2% |
| Cape Verdeans | 0.0 /100 | #319 | Tragic 15.0% |
Demographics Similar to Jordanians by 3 or more Vehicles in Household
In terms of 3 or more vehicles in household, the demographic groups most similar to Jordanians are Lithuanian (20.1%, a difference of 0.0%), Ottawa (20.1%, a difference of 0.060%), Iranian (20.1%, a difference of 0.060%), Palestinian (20.1%, a difference of 0.070%), and Australian (20.1%, a difference of 0.11%).
| Demographics | Rating | Rank | 3 or more Vehicles in Household |
| Immigrants | India | 87.2 /100 | #135 | Excellent 20.2% |
| Immigrants | Nicaragua | 87.1 /100 | #136 | Excellent 20.2% |
| Immigrants | Iraq | 87.1 /100 | #137 | Excellent 20.2% |
| Aleuts | 86.3 /100 | #138 | Excellent 20.2% |
| Slovenes | 85.5 /100 | #139 | Excellent 20.2% |
| French American Indians | 85.3 /100 | #140 | Excellent 20.1% |
| Ottawa | 84.9 /100 | #141 | Excellent 20.1% |
| Jordanians | 84.4 /100 | #142 | Excellent 20.1% |
| Lithuanians | 84.4 /100 | #143 | Excellent 20.1% |
| Iranians | 84.0 /100 | #144 | Excellent 20.1% |
| Palestinians | 83.9 /100 | #145 | Excellent 20.1% |
| Australians | 83.6 /100 | #146 | Excellent 20.1% |
| Slovaks | 83.0 /100 | #147 | Excellent 20.1% |
| Guatemalans | 82.6 /100 | #148 | Excellent 20.1% |
| Immigrants | Iran | 80.9 /100 | #149 | Excellent 20.0% |