Immigrants from Nepal vs Jordanian 3 or more Vehicles in Household
COMPARE
Immigrants from Nepal
Jordanian
3 or more Vehicles in Household
3 or more Vehicles in Household Comparison
Immigrants from Nepal
Jordanians
17.6%
3 OR MORE VEHICLES IN HOUSEHOLD
0.6/ 100
METRIC RATING
270th/ 347
METRIC RANK
20.1%
3 OR MORE VEHICLES IN HOUSEHOLD
84.4/ 100
METRIC RATING
142nd/ 347
METRIC RANK
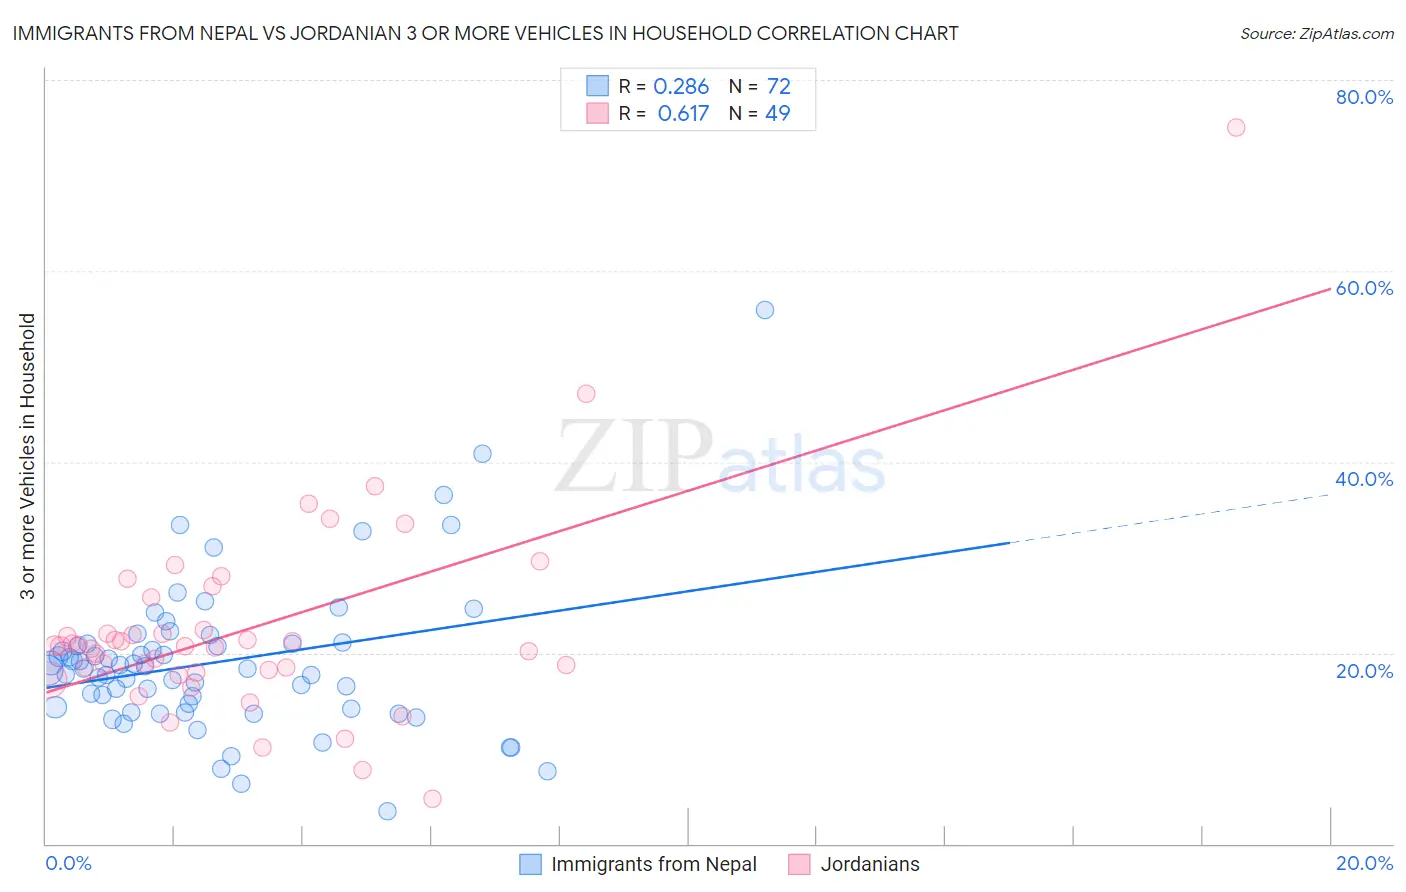
Immigrants from Nepal vs Jordanian 3 or more Vehicles in Household Correlation Chart
The statistical analysis conducted on geographies consisting of 186,663,227 people shows a weak positive correlation between the proportion of Immigrants from Nepal and percentage of households with 3 or more vehicles available in the United States with a correlation coefficient (R) of 0.286 and weighted average of 17.6%. Similarly, the statistical analysis conducted on geographies consisting of 166,358,031 people shows a significant positive correlation between the proportion of Jordanians and percentage of households with 3 or more vehicles available in the United States with a correlation coefficient (R) of 0.617 and weighted average of 20.1%, a difference of 14.1%.
3 or more Vehicles in Household Correlation Summary
| Measurement | Immigrants from Nepal | Jordanian |
| Minimum | 3.4% | 4.7% |
| Maximum | 55.9% | 75.0% |
| Range | 52.5% | 70.3% |
| Mean | 19.0% | 22.4% |
| Median | 18.3% | 20.7% |
| Interquartile 25% (IQ1) | 14.2% | 18.0% |
| Interquartile 75% (IQ3) | 21.0% | 24.1% |
| Interquartile Range (IQR) | 6.8% | 6.0% |
| Standard Deviation (Sample) | 8.0% | 10.8% |
| Standard Deviation (Population) | 8.0% | 10.7% |
Similar Demographics by 3 or more Vehicles in Household
Demographics Similar to Immigrants from Nepal by 3 or more Vehicles in Household
In terms of 3 or more vehicles in household, the demographic groups most similar to Immigrants from Nepal are South American (17.6%, a difference of 0.0%), Immigrants from France (17.6%, a difference of 0.050%), Immigrants from Africa (17.6%, a difference of 0.41%), Immigrants from Sudan (17.6%, a difference of 0.45%), and Immigrants from Bulgaria (17.7%, a difference of 0.47%).
| Demographics | Rating | Rank | 3 or more Vehicles in Household |
| Bermudans | 0.9 /100 | #263 | Tragic 17.8% |
| Cambodians | 0.9 /100 | #264 | Tragic 17.8% |
| Immigrants | Panama | 0.8 /100 | #265 | Tragic 17.7% |
| Macedonians | 0.8 /100 | #266 | Tragic 17.7% |
| Immigrants | Venezuela | 0.8 /100 | #267 | Tragic 17.7% |
| Immigrants | Bulgaria | 0.8 /100 | #268 | Tragic 17.7% |
| Immigrants | France | 0.6 /100 | #269 | Tragic 17.6% |
| Immigrants | Nepal | 0.6 /100 | #270 | Tragic 17.6% |
| South Americans | 0.6 /100 | #271 | Tragic 17.6% |
| Immigrants | Africa | 0.5 /100 | #272 | Tragic 17.6% |
| Immigrants | Sudan | 0.5 /100 | #273 | Tragic 17.6% |
| Immigrants | Bosnia and Herzegovina | 0.5 /100 | #274 | Tragic 17.5% |
| Immigrants | Ukraine | 0.4 /100 | #275 | Tragic 17.5% |
| Okinawans | 0.4 /100 | #276 | Tragic 17.4% |
| Brazilians | 0.4 /100 | #277 | Tragic 17.4% |
Demographics Similar to Jordanians by 3 or more Vehicles in Household
In terms of 3 or more vehicles in household, the demographic groups most similar to Jordanians are Lithuanian (20.1%, a difference of 0.0%), Ottawa (20.1%, a difference of 0.060%), Iranian (20.1%, a difference of 0.060%), Palestinian (20.1%, a difference of 0.070%), and Australian (20.1%, a difference of 0.11%).
| Demographics | Rating | Rank | 3 or more Vehicles in Household |
| Immigrants | India | 87.2 /100 | #135 | Excellent 20.2% |
| Immigrants | Nicaragua | 87.1 /100 | #136 | Excellent 20.2% |
| Immigrants | Iraq | 87.1 /100 | #137 | Excellent 20.2% |
| Aleuts | 86.3 /100 | #138 | Excellent 20.2% |
| Slovenes | 85.5 /100 | #139 | Excellent 20.2% |
| French American Indians | 85.3 /100 | #140 | Excellent 20.1% |
| Ottawa | 84.9 /100 | #141 | Excellent 20.1% |
| Jordanians | 84.4 /100 | #142 | Excellent 20.1% |
| Lithuanians | 84.4 /100 | #143 | Excellent 20.1% |
| Iranians | 84.0 /100 | #144 | Excellent 20.1% |
| Palestinians | 83.9 /100 | #145 | Excellent 20.1% |
| Australians | 83.6 /100 | #146 | Excellent 20.1% |
| Slovaks | 83.0 /100 | #147 | Excellent 20.1% |
| Guatemalans | 82.6 /100 | #148 | Excellent 20.1% |
| Immigrants | Iran | 80.9 /100 | #149 | Excellent 20.0% |