Immigrants from Jordan vs Crow Male Poverty
COMPARE
Immigrants from Jordan
Crow
Male Poverty
Male Poverty Comparison
Immigrants from Jordan
Crow
10.8%
MALE POVERTY
77.5/ 100
METRIC RATING
139th/ 347
METRIC RANK
19.1%
MALE POVERTY
0.0/ 100
METRIC RATING
338th/ 347
METRIC RANK
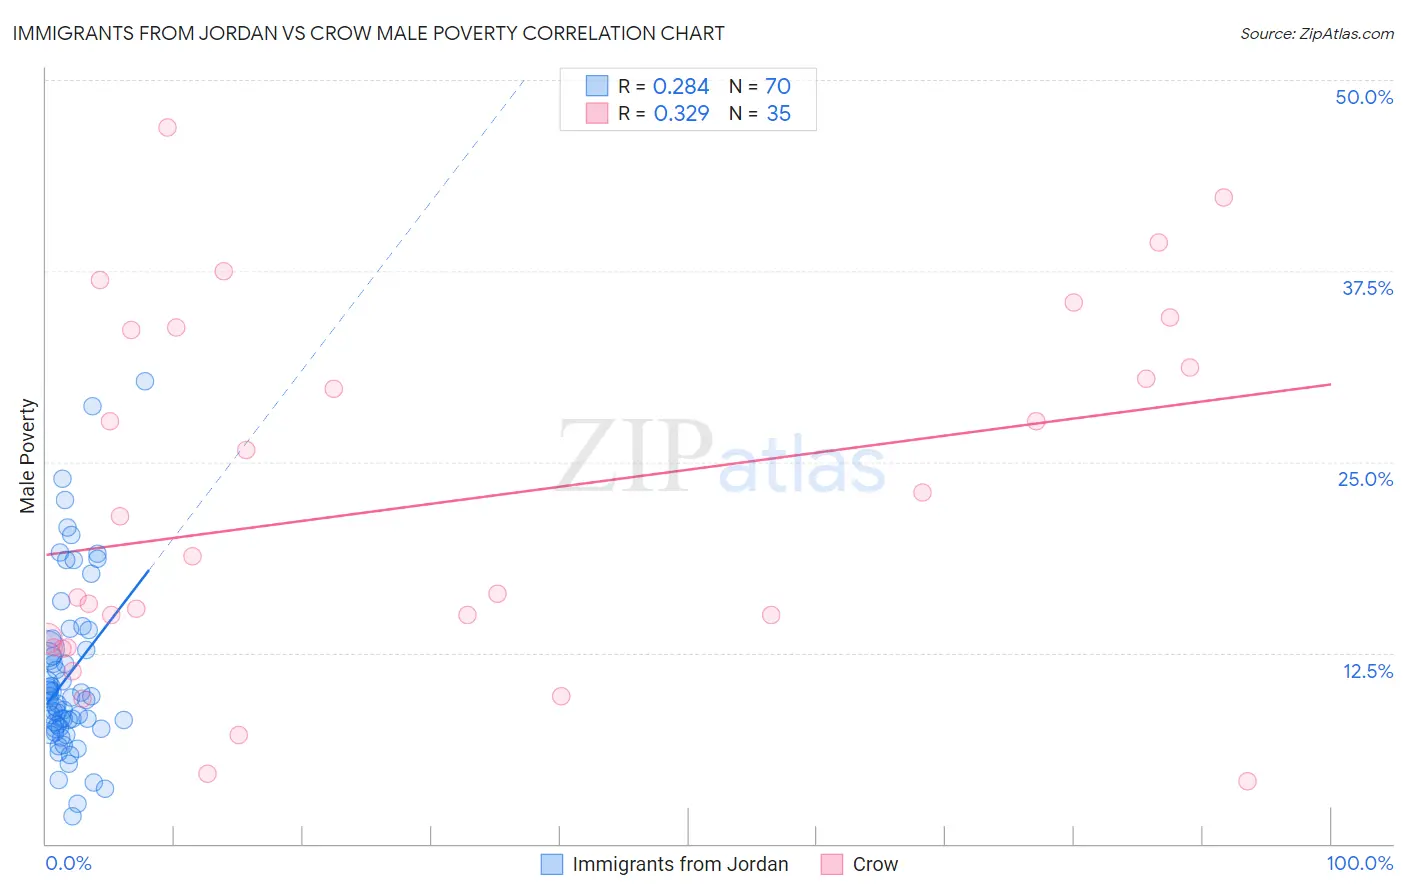
Immigrants from Jordan vs Crow Male Poverty Correlation Chart
The statistical analysis conducted on geographies consisting of 181,249,904 people shows a weak positive correlation between the proportion of Immigrants from Jordan and poverty level among males in the United States with a correlation coefficient (R) of 0.284 and weighted average of 10.8%. Similarly, the statistical analysis conducted on geographies consisting of 59,196,119 people shows a mild positive correlation between the proportion of Crow and poverty level among males in the United States with a correlation coefficient (R) of 0.329 and weighted average of 19.1%, a difference of 76.3%.
Male Poverty Correlation Summary
| Measurement | Immigrants from Jordan | Crow |
| Minimum | 1.8% | 4.1% |
| Maximum | 30.3% | 46.9% |
| Range | 28.5% | 42.8% |
| Mean | 11.0% | 22.4% |
| Median | 9.5% | 18.8% |
| Interquartile 25% (IQ1) | 7.6% | 12.8% |
| Interquartile 75% (IQ3) | 12.7% | 33.6% |
| Interquartile Range (IQR) | 5.2% | 20.8% |
| Standard Deviation (Sample) | 5.7% | 11.6% |
| Standard Deviation (Population) | 5.7% | 11.5% |
Similar Demographics by Male Poverty
Demographics Similar to Immigrants from Jordan by Male Poverty
In terms of male poverty, the demographic groups most similar to Immigrants from Jordan are Yugoslavian (10.8%, a difference of 0.12%), Tlingit-Haida (10.9%, a difference of 0.19%), Immigrants from France (10.9%, a difference of 0.23%), Immigrants from Switzerland (10.8%, a difference of 0.27%), and Basque (10.9%, a difference of 0.40%).
| Demographics | Rating | Rank | Male Poverty |
| Immigrants | Vietnam | 83.0 /100 | #132 | Excellent 10.8% |
| Pakistanis | 83.0 /100 | #133 | Excellent 10.8% |
| New Zealanders | 82.9 /100 | #134 | Excellent 10.8% |
| Brazilians | 82.7 /100 | #135 | Excellent 10.8% |
| Immigrants | Israel | 80.9 /100 | #136 | Excellent 10.8% |
| Immigrants | Switzerland | 79.2 /100 | #137 | Good 10.8% |
| Yugoslavians | 78.2 /100 | #138 | Good 10.8% |
| Immigrants | Jordan | 77.5 /100 | #139 | Good 10.8% |
| Tlingit-Haida | 76.1 /100 | #140 | Good 10.9% |
| Immigrants | France | 75.8 /100 | #141 | Good 10.9% |
| Basques | 74.6 /100 | #142 | Good 10.9% |
| Afghans | 71.9 /100 | #143 | Good 10.9% |
| Samoans | 71.8 /100 | #144 | Good 10.9% |
| Immigrants | Germany | 71.6 /100 | #145 | Good 10.9% |
| Syrians | 71.4 /100 | #146 | Good 10.9% |
Demographics Similar to Crow by Male Poverty
In terms of male poverty, the demographic groups most similar to Crow are Yuman (19.5%, a difference of 2.2%), Sioux (18.7%, a difference of 2.3%), Pueblo (18.5%, a difference of 3.4%), Immigrants from Yemen (20.1%, a difference of 5.3%), and Lumbee (20.2%, a difference of 5.6%).
| Demographics | Rating | Rank | Male Poverty |
| Ute | 0.0 /100 | #331 | Tragic 16.2% |
| Houma | 0.0 /100 | #332 | Tragic 16.7% |
| Natives/Alaskans | 0.0 /100 | #333 | Tragic 16.9% |
| Cheyenne | 0.0 /100 | #334 | Tragic 17.6% |
| Apache | 0.0 /100 | #335 | Tragic 17.7% |
| Pueblo | 0.0 /100 | #336 | Tragic 18.5% |
| Sioux | 0.0 /100 | #337 | Tragic 18.7% |
| Crow | 0.0 /100 | #338 | Tragic 19.1% |
| Yuman | 0.0 /100 | #339 | Tragic 19.5% |
| Immigrants | Yemen | 0.0 /100 | #340 | Tragic 20.1% |
| Lumbee | 0.0 /100 | #341 | Tragic 20.2% |
| Pima | 0.0 /100 | #342 | Tragic 20.4% |
| Yup'ik | 0.0 /100 | #343 | Tragic 20.4% |
| Hopi | 0.0 /100 | #344 | Tragic 20.8% |
| Puerto Ricans | 0.0 /100 | #345 | Tragic 22.0% |