Immigrants from Western Asia vs Crow 3 or more Vehicles in Household
COMPARE
Immigrants from Western Asia
Crow
3 or more Vehicles in Household
3 or more Vehicles in Household Comparison
Immigrants from Western Asia
Crow
18.4%
3 OR MORE VEHICLES IN HOUSEHOLD
4.8/ 100
METRIC RATING
230th/ 347
METRIC RANK
22.5%
3 OR MORE VEHICLES IN HOUSEHOLD
100.0/ 100
METRIC RATING
54th/ 347
METRIC RANK
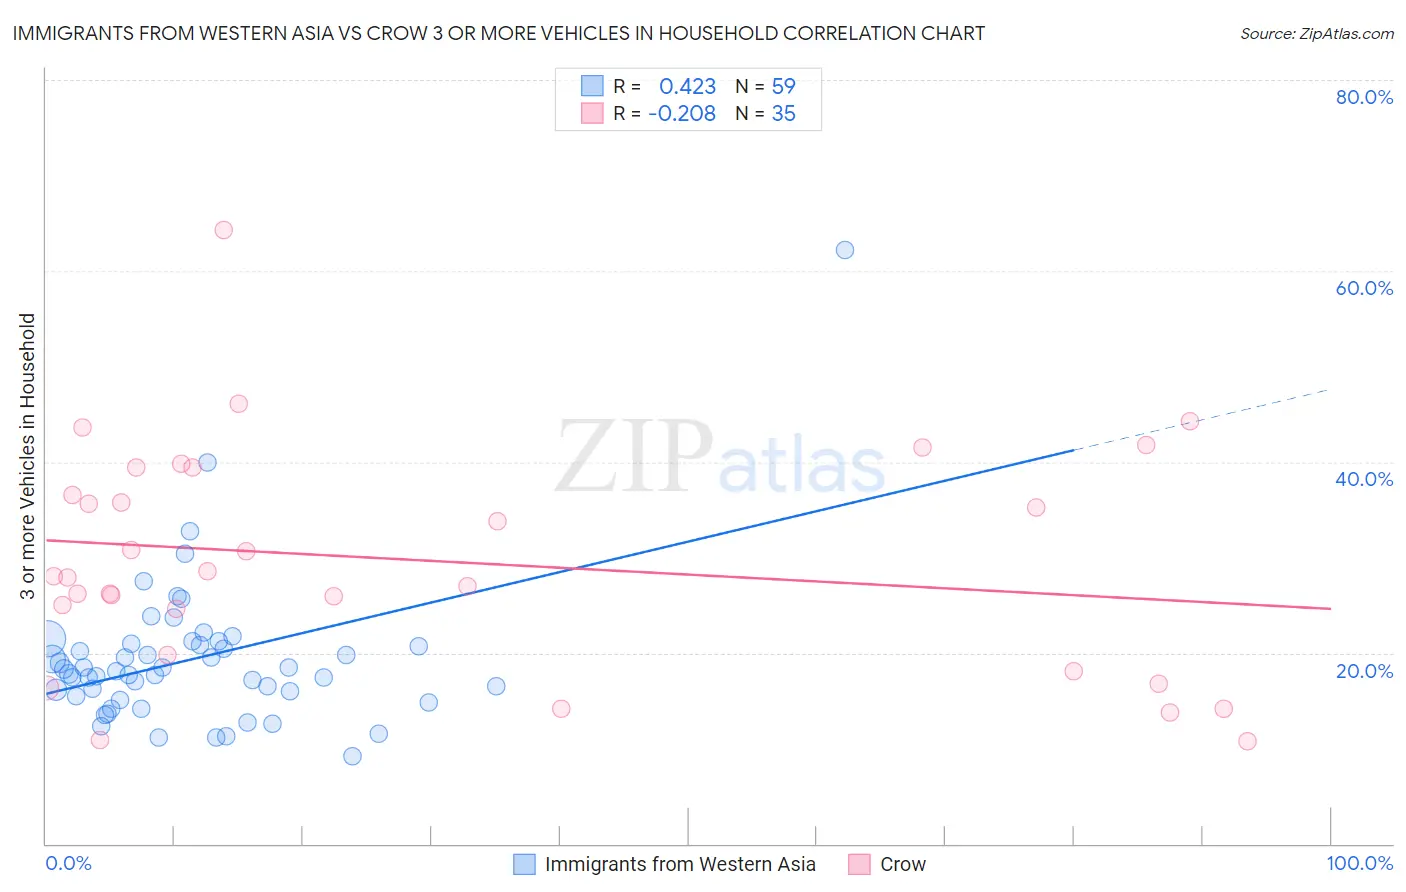
Immigrants from Western Asia vs Crow 3 or more Vehicles in Household Correlation Chart
The statistical analysis conducted on geographies consisting of 404,016,930 people shows a moderate positive correlation between the proportion of Immigrants from Western Asia and percentage of households with 3 or more vehicles available in the United States with a correlation coefficient (R) of 0.423 and weighted average of 18.4%. Similarly, the statistical analysis conducted on geographies consisting of 59,203,014 people shows a weak negative correlation between the proportion of Crow and percentage of households with 3 or more vehicles available in the United States with a correlation coefficient (R) of -0.208 and weighted average of 22.5%, a difference of 22.1%.
3 or more Vehicles in Household Correlation Summary
| Measurement | Immigrants from Western Asia | Crow |
| Minimum | 9.2% | 10.8% |
| Maximum | 62.2% | 64.3% |
| Range | 52.9% | 53.5% |
| Mean | 19.4% | 29.7% |
| Median | 18.1% | 28.0% |
| Interquartile 25% (IQ1) | 15.4% | 19.8% |
| Interquartile 75% (IQ3) | 21.0% | 39.4% |
| Interquartile Range (IQR) | 5.6% | 19.6% |
| Standard Deviation (Sample) | 7.8% | 11.8% |
| Standard Deviation (Population) | 7.8% | 11.7% |
Similar Demographics by 3 or more Vehicles in Household
Demographics Similar to Immigrants from Western Asia by 3 or more Vehicles in Household
In terms of 3 or more vehicles in household, the demographic groups most similar to Immigrants from Western Asia are Immigrants from Belgium (18.4%, a difference of 0.030%), Immigrants from Switzerland (18.4%, a difference of 0.060%), Immigrants from Uganda (18.4%, a difference of 0.090%), Honduran (18.4%, a difference of 0.11%), and Immigrants from North Macedonia (18.4%, a difference of 0.17%).
| Demographics | Rating | Rank | 3 or more Vehicles in Household |
| Immigrants | Czechoslovakia | 5.9 /100 | #223 | Tragic 18.5% |
| Immigrants | Argentina | 5.6 /100 | #224 | Tragic 18.5% |
| Immigrants | Lithuania | 5.6 /100 | #225 | Tragic 18.5% |
| Immigrants | Hungary | 5.5 /100 | #226 | Tragic 18.5% |
| Immigrants | Singapore | 5.4 /100 | #227 | Tragic 18.4% |
| Turks | 5.4 /100 | #228 | Tragic 18.4% |
| Immigrants | Switzerland | 5.0 /100 | #229 | Tragic 18.4% |
| Immigrants | Western Asia | 4.8 /100 | #230 | Tragic 18.4% |
| Immigrants | Belgium | 4.8 /100 | #231 | Tragic 18.4% |
| Immigrants | Uganda | 4.6 /100 | #232 | Tragic 18.4% |
| Hondurans | 4.6 /100 | #233 | Tragic 18.4% |
| Immigrants | North Macedonia | 4.4 /100 | #234 | Tragic 18.4% |
| Sierra Leoneans | 3.9 /100 | #235 | Tragic 18.3% |
| Immigrants | Malaysia | 3.6 /100 | #236 | Tragic 18.3% |
| Indonesians | 3.5 /100 | #237 | Tragic 18.3% |
Demographics Similar to Crow by 3 or more Vehicles in Household
In terms of 3 or more vehicles in household, the demographic groups most similar to Crow are Czech (22.5%, a difference of 0.21%), Immigrants from Laos (22.4%, a difference of 0.37%), Hispanic or Latino (22.4%, a difference of 0.40%), Welsh (22.6%, a difference of 0.47%), and White/Caucasian (22.6%, a difference of 0.51%).
| Demographics | Rating | Rank | 3 or more Vehicles in Household |
| Malaysians | 100.0 /100 | #47 | Exceptional 22.6% |
| Scottish | 100.0 /100 | #48 | Exceptional 22.6% |
| Scotch-Irish | 100.0 /100 | #49 | Exceptional 22.6% |
| Sioux | 100.0 /100 | #50 | Exceptional 22.6% |
| Whites/Caucasians | 100.0 /100 | #51 | Exceptional 22.6% |
| Welsh | 100.0 /100 | #52 | Exceptional 22.6% |
| Czechs | 100.0 /100 | #53 | Exceptional 22.5% |
| Crow | 100.0 /100 | #54 | Exceptional 22.5% |
| Immigrants | Laos | 100.0 /100 | #55 | Exceptional 22.4% |
| Hispanics or Latinos | 100.0 /100 | #56 | Exceptional 22.4% |
| Pennsylvania Germans | 100.0 /100 | #57 | Exceptional 22.3% |
| Spaniards | 100.0 /100 | #58 | Exceptional 22.3% |
| Navajo | 100.0 /100 | #59 | Exceptional 22.3% |
| Finns | 99.9 /100 | #60 | Exceptional 22.3% |
| Bhutanese | 99.9 /100 | #61 | Exceptional 22.2% |