Iranian vs Cape Verdean 3 or more Vehicles in Household
COMPARE
Iranian
Cape Verdean
3 or more Vehicles in Household
3 or more Vehicles in Household Comparison
Iranians
Cape Verdeans
20.1%
3 OR MORE VEHICLES IN HOUSEHOLD
84.0/ 100
METRIC RATING
144th/ 347
METRIC RANK
15.0%
3 OR MORE VEHICLES IN HOUSEHOLD
0.0/ 100
METRIC RATING
319th/ 347
METRIC RANK
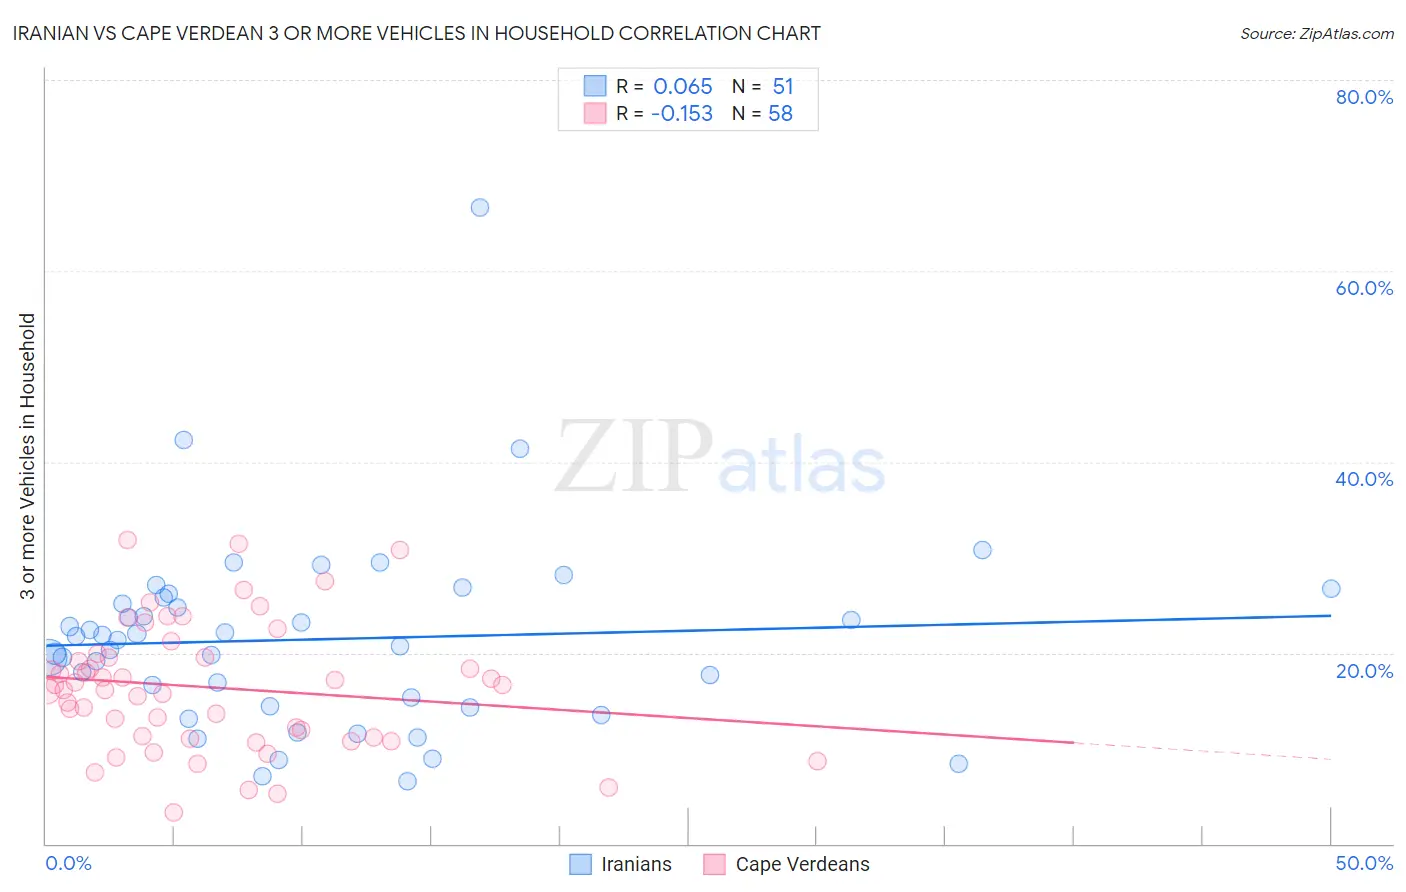
Iranian vs Cape Verdean 3 or more Vehicles in Household Correlation Chart
The statistical analysis conducted on geographies consisting of 316,534,374 people shows a slight positive correlation between the proportion of Iranians and percentage of households with 3 or more vehicles available in the United States with a correlation coefficient (R) of 0.065 and weighted average of 20.1%. Similarly, the statistical analysis conducted on geographies consisting of 107,543,887 people shows a poor negative correlation between the proportion of Cape Verdeans and percentage of households with 3 or more vehicles available in the United States with a correlation coefficient (R) of -0.153 and weighted average of 15.0%, a difference of 34.1%.
3 or more Vehicles in Household Correlation Summary
| Measurement | Iranian | Cape Verdean |
| Minimum | 6.6% | 3.3% |
| Maximum | 66.7% | 31.8% |
| Range | 60.1% | 28.5% |
| Mean | 21.4% | 16.4% |
| Median | 21.4% | 16.3% |
| Interquartile 25% (IQ1) | 14.4% | 11.2% |
| Interquartile 75% (IQ3) | 25.7% | 19.5% |
| Interquartile Range (IQR) | 11.3% | 8.4% |
| Standard Deviation (Sample) | 10.1% | 6.6% |
| Standard Deviation (Population) | 10.0% | 6.6% |
Similar Demographics by 3 or more Vehicles in Household
Demographics Similar to Iranians by 3 or more Vehicles in Household
In terms of 3 or more vehicles in household, the demographic groups most similar to Iranians are Palestinian (20.1%, a difference of 0.010%), Lithuanian (20.1%, a difference of 0.050%), Australian (20.1%, a difference of 0.050%), Jordanian (20.1%, a difference of 0.060%), and Ottawa (20.1%, a difference of 0.12%).
| Demographics | Rating | Rank | 3 or more Vehicles in Household |
| Immigrants | Iraq | 87.1 /100 | #137 | Excellent 20.2% |
| Aleuts | 86.3 /100 | #138 | Excellent 20.2% |
| Slovenes | 85.5 /100 | #139 | Excellent 20.2% |
| French American Indians | 85.3 /100 | #140 | Excellent 20.1% |
| Ottawa | 84.9 /100 | #141 | Excellent 20.1% |
| Jordanians | 84.4 /100 | #142 | Excellent 20.1% |
| Lithuanians | 84.4 /100 | #143 | Excellent 20.1% |
| Iranians | 84.0 /100 | #144 | Excellent 20.1% |
| Palestinians | 83.9 /100 | #145 | Excellent 20.1% |
| Australians | 83.6 /100 | #146 | Excellent 20.1% |
| Slovaks | 83.0 /100 | #147 | Excellent 20.1% |
| Guatemalans | 82.6 /100 | #148 | Excellent 20.1% |
| Immigrants | Iran | 80.9 /100 | #149 | Excellent 20.0% |
| Immigrants | Immigrants | 80.8 /100 | #150 | Excellent 20.0% |
| Taiwanese | 80.6 /100 | #151 | Excellent 20.0% |
Demographics Similar to Cape Verdeans by 3 or more Vehicles in Household
In terms of 3 or more vehicles in household, the demographic groups most similar to Cape Verdeans are Yup'ik (14.8%, a difference of 1.1%), Immigrants from Haiti (15.2%, a difference of 1.2%), Jamaican (15.2%, a difference of 1.4%), Immigrants from Jamaica (14.7%, a difference of 2.2%), and Immigrants from West Indies (14.6%, a difference of 2.5%).
| Demographics | Rating | Rank | 3 or more Vehicles in Household |
| Puerto Ricans | 0.0 /100 | #312 | Tragic 15.6% |
| Immigrants | Israel | 0.0 /100 | #313 | Tragic 15.6% |
| Immigrants | Belarus | 0.0 /100 | #314 | Tragic 15.5% |
| Haitians | 0.0 /100 | #315 | Tragic 15.5% |
| U.S. Virgin Islanders | 0.0 /100 | #316 | Tragic 15.4% |
| Jamaicans | 0.0 /100 | #317 | Tragic 15.2% |
| Immigrants | Haiti | 0.0 /100 | #318 | Tragic 15.2% |
| Cape Verdeans | 0.0 /100 | #319 | Tragic 15.0% |
| Yup'ik | 0.0 /100 | #320 | Tragic 14.8% |
| Immigrants | Jamaica | 0.0 /100 | #321 | Tragic 14.7% |
| Immigrants | West Indies | 0.0 /100 | #322 | Tragic 14.6% |
| Immigrants | Caribbean | 0.0 /100 | #323 | Tragic 14.6% |
| Immigrants | Yemen | 0.0 /100 | #324 | Tragic 14.2% |
| Senegalese | 0.0 /100 | #325 | Tragic 14.2% |
| Soviet Union | 0.0 /100 | #326 | Tragic 14.2% |