Guamanian/Chamorro vs Cape Verdean 3 or more Vehicles in Household
COMPARE
Guamanian/Chamorro
Cape Verdean
3 or more Vehicles in Household
3 or more Vehicles in Household Comparison
Guamanians/Chamorros
Cape Verdeans
23.2%
3 OR MORE VEHICLES IN HOUSEHOLD
100.0/ 100
METRIC RATING
27th/ 347
METRIC RANK
15.0%
3 OR MORE VEHICLES IN HOUSEHOLD
0.0/ 100
METRIC RATING
319th/ 347
METRIC RANK
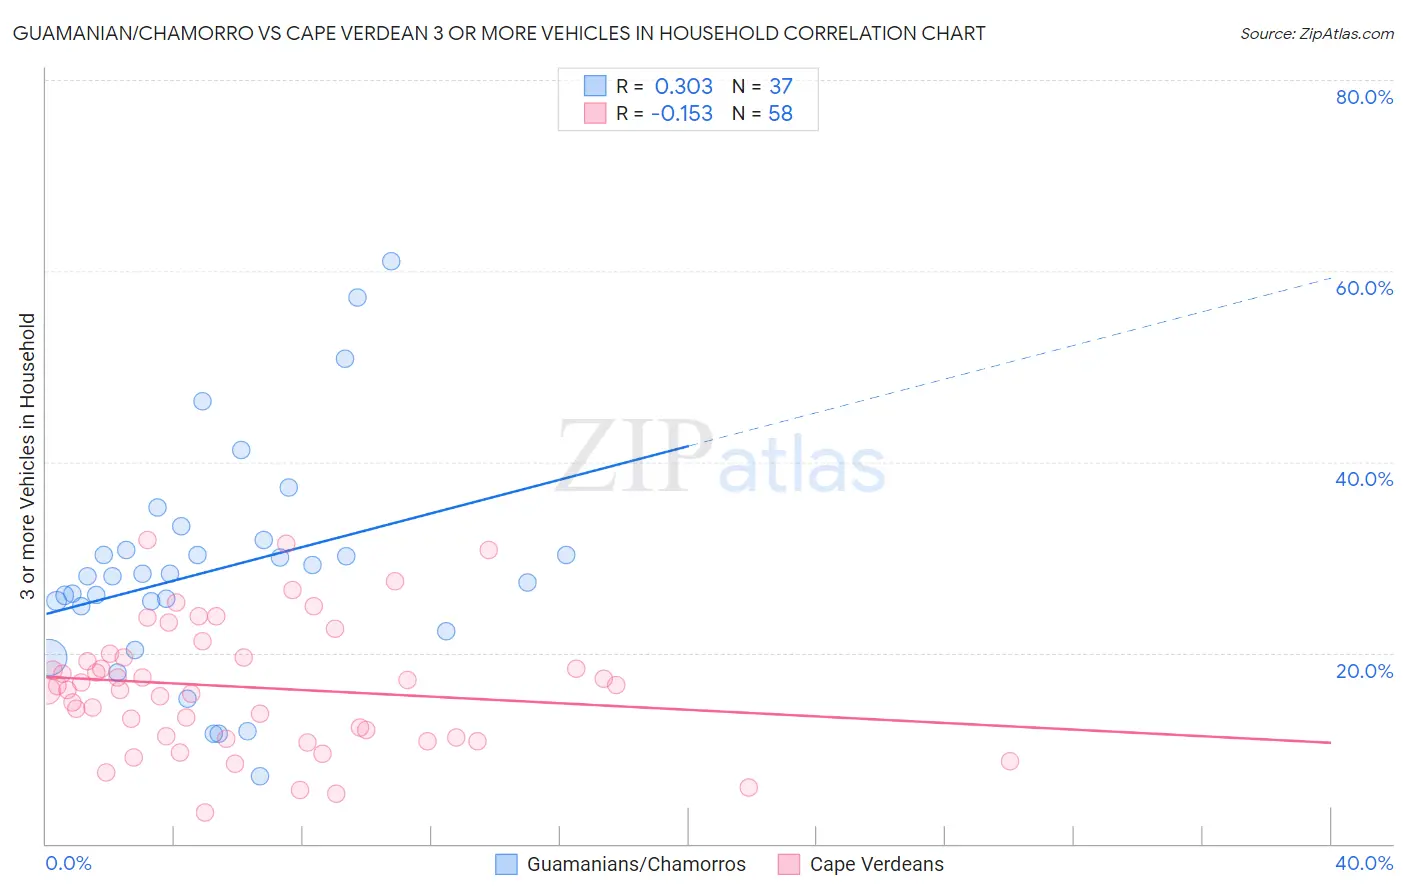
Guamanian/Chamorro vs Cape Verdean 3 or more Vehicles in Household Correlation Chart
The statistical analysis conducted on geographies consisting of 221,863,982 people shows a mild positive correlation between the proportion of Guamanians/Chamorros and percentage of households with 3 or more vehicles available in the United States with a correlation coefficient (R) of 0.303 and weighted average of 23.2%. Similarly, the statistical analysis conducted on geographies consisting of 107,543,887 people shows a poor negative correlation between the proportion of Cape Verdeans and percentage of households with 3 or more vehicles available in the United States with a correlation coefficient (R) of -0.153 and weighted average of 15.0%, a difference of 54.9%.
3 or more Vehicles in Household Correlation Summary
| Measurement | Guamanian/Chamorro | Cape Verdean |
| Minimum | 7.1% | 3.3% |
| Maximum | 61.0% | 31.8% |
| Range | 53.9% | 28.5% |
| Mean | 28.7% | 16.4% |
| Median | 28.0% | 16.3% |
| Interquartile 25% (IQ1) | 23.6% | 11.2% |
| Interquartile 75% (IQ3) | 31.3% | 19.5% |
| Interquartile Range (IQR) | 7.8% | 8.4% |
| Standard Deviation (Sample) | 11.6% | 6.6% |
| Standard Deviation (Population) | 11.5% | 6.6% |
Similar Demographics by 3 or more Vehicles in Household
Demographics Similar to Guamanians/Chamorros by 3 or more Vehicles in Household
In terms of 3 or more vehicles in household, the demographic groups most similar to Guamanians/Chamorros are Mexican American Indian (23.3%, a difference of 0.13%), Lumbee (23.1%, a difference of 0.33%), Spanish (23.1%, a difference of 0.40%), Immigrants from South Eastern Asia (23.1%, a difference of 0.57%), and English (23.1%, a difference of 0.76%).
| Demographics | Rating | Rank | 3 or more Vehicles in Household |
| Paiute | 100.0 /100 | #20 | Exceptional 23.8% |
| Immigrants | Vietnam | 100.0 /100 | #21 | Exceptional 23.8% |
| Immigrants | Philippines | 100.0 /100 | #22 | Exceptional 23.8% |
| Scandinavians | 100.0 /100 | #23 | Exceptional 23.6% |
| Sri Lankans | 100.0 /100 | #24 | Exceptional 23.6% |
| Immigrants | Central America | 100.0 /100 | #25 | Exceptional 23.4% |
| Mexican American Indians | 100.0 /100 | #26 | Exceptional 23.3% |
| Guamanians/Chamorros | 100.0 /100 | #27 | Exceptional 23.2% |
| Lumbee | 100.0 /100 | #28 | Exceptional 23.1% |
| Spanish | 100.0 /100 | #29 | Exceptional 23.1% |
| Immigrants | South Eastern Asia | 100.0 /100 | #30 | Exceptional 23.1% |
| English | 100.0 /100 | #31 | Exceptional 23.1% |
| Pueblo | 100.0 /100 | #32 | Exceptional 23.0% |
| Spanish Americans | 100.0 /100 | #33 | Exceptional 23.0% |
| Swiss | 100.0 /100 | #34 | Exceptional 23.0% |
Demographics Similar to Cape Verdeans by 3 or more Vehicles in Household
In terms of 3 or more vehicles in household, the demographic groups most similar to Cape Verdeans are Yup'ik (14.8%, a difference of 1.1%), Immigrants from Haiti (15.2%, a difference of 1.2%), Jamaican (15.2%, a difference of 1.4%), Immigrants from Jamaica (14.7%, a difference of 2.2%), and Immigrants from West Indies (14.6%, a difference of 2.5%).
| Demographics | Rating | Rank | 3 or more Vehicles in Household |
| Puerto Ricans | 0.0 /100 | #312 | Tragic 15.6% |
| Immigrants | Israel | 0.0 /100 | #313 | Tragic 15.6% |
| Immigrants | Belarus | 0.0 /100 | #314 | Tragic 15.5% |
| Haitians | 0.0 /100 | #315 | Tragic 15.5% |
| U.S. Virgin Islanders | 0.0 /100 | #316 | Tragic 15.4% |
| Jamaicans | 0.0 /100 | #317 | Tragic 15.2% |
| Immigrants | Haiti | 0.0 /100 | #318 | Tragic 15.2% |
| Cape Verdeans | 0.0 /100 | #319 | Tragic 15.0% |
| Yup'ik | 0.0 /100 | #320 | Tragic 14.8% |
| Immigrants | Jamaica | 0.0 /100 | #321 | Tragic 14.7% |
| Immigrants | West Indies | 0.0 /100 | #322 | Tragic 14.6% |
| Immigrants | Caribbean | 0.0 /100 | #323 | Tragic 14.6% |
| Immigrants | Yemen | 0.0 /100 | #324 | Tragic 14.2% |
| Senegalese | 0.0 /100 | #325 | Tragic 14.2% |
| Soviet Union | 0.0 /100 | #326 | Tragic 14.2% |