Colombian vs Immigrants from Kenya 3 or more Vehicles in Household
COMPARE
Colombian
Immigrants from Kenya
3 or more Vehicles in Household
3 or more Vehicles in Household Comparison
Colombians
Immigrants from Kenya
17.8%
3 OR MORE VEHICLES IN HOUSEHOLD
0.9/ 100
METRIC RATING
262nd/ 347
METRIC RANK
18.8%
3 OR MORE VEHICLES IN HOUSEHOLD
12.4/ 100
METRIC RATING
211th/ 347
METRIC RANK
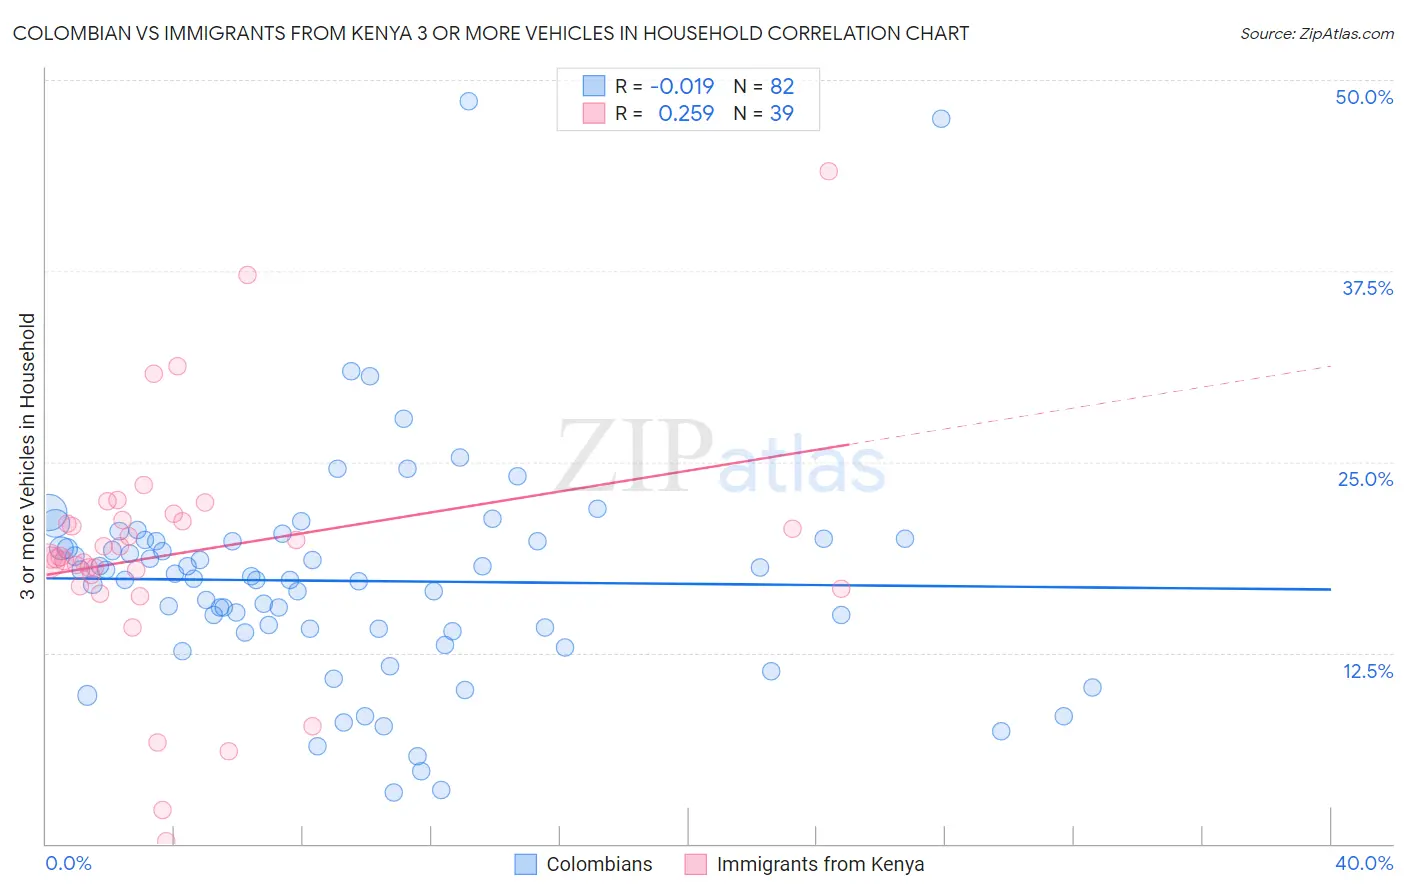
Colombian vs Immigrants from Kenya 3 or more Vehicles in Household Correlation Chart
The statistical analysis conducted on geographies consisting of 419,151,305 people shows no correlation between the proportion of Colombians and percentage of households with 3 or more vehicles available in the United States with a correlation coefficient (R) of -0.019 and weighted average of 17.8%. Similarly, the statistical analysis conducted on geographies consisting of 217,959,739 people shows a weak positive correlation between the proportion of Immigrants from Kenya and percentage of households with 3 or more vehicles available in the United States with a correlation coefficient (R) of 0.259 and weighted average of 18.8%, a difference of 5.6%.
3 or more Vehicles in Household Correlation Summary
| Measurement | Colombian | Immigrants from Kenya |
| Minimum | 3.4% | 0.19% |
| Maximum | 48.6% | 44.0% |
| Range | 45.2% | 43.8% |
| Mean | 17.2% | 19.1% |
| Median | 17.3% | 18.7% |
| Interquartile 25% (IQ1) | 13.9% | 16.9% |
| Interquartile 75% (IQ3) | 19.8% | 21.2% |
| Interquartile Range (IQR) | 5.9% | 4.3% |
| Standard Deviation (Sample) | 7.4% | 8.1% |
| Standard Deviation (Population) | 7.3% | 8.0% |
Similar Demographics by 3 or more Vehicles in Household
Demographics Similar to Colombians by 3 or more Vehicles in Household
In terms of 3 or more vehicles in household, the demographic groups most similar to Colombians are Immigrants from Northern Africa (17.8%, a difference of 0.030%), Ugandan (17.8%, a difference of 0.050%), Bermudan (17.8%, a difference of 0.11%), Cambodian (17.8%, a difference of 0.14%), and Uruguayan (17.8%, a difference of 0.18%).
| Demographics | Rating | Rank | 3 or more Vehicles in Household |
| Immigrants | Turkey | 1.2 /100 | #255 | Tragic 17.9% |
| Sub-Saharan Africans | 1.1 /100 | #256 | Tragic 17.9% |
| Immigrants | Eritrea | 1.1 /100 | #257 | Tragic 17.8% |
| Sudanese | 1.1 /100 | #258 | Tragic 17.8% |
| Uruguayans | 1.0 /100 | #259 | Tragic 17.8% |
| Ugandans | 0.9 /100 | #260 | Tragic 17.8% |
| Immigrants | Northern Africa | 0.9 /100 | #261 | Tragic 17.8% |
| Colombians | 0.9 /100 | #262 | Tragic 17.8% |
| Bermudans | 0.9 /100 | #263 | Tragic 17.8% |
| Cambodians | 0.9 /100 | #264 | Tragic 17.8% |
| Immigrants | Panama | 0.8 /100 | #265 | Tragic 17.7% |
| Macedonians | 0.8 /100 | #266 | Tragic 17.7% |
| Immigrants | Venezuela | 0.8 /100 | #267 | Tragic 17.7% |
| Immigrants | Bulgaria | 0.8 /100 | #268 | Tragic 17.7% |
| Immigrants | France | 0.6 /100 | #269 | Tragic 17.6% |
Demographics Similar to Immigrants from Kenya by 3 or more Vehicles in Household
In terms of 3 or more vehicles in household, the demographic groups most similar to Immigrants from Kenya are Bulgarian (18.8%, a difference of 0.12%), Panamanian (18.8%, a difference of 0.14%), Immigrants from Cuba (18.8%, a difference of 0.15%), Immigrants from Egypt (18.8%, a difference of 0.20%), and Immigrants from Chile (18.8%, a difference of 0.21%).
| Demographics | Rating | Rank | 3 or more Vehicles in Household |
| Immigrants | Romania | 14.6 /100 | #204 | Poor 18.9% |
| Russians | 14.2 /100 | #205 | Poor 18.8% |
| Immigrants | Eastern Asia | 14.1 /100 | #206 | Poor 18.8% |
| Immigrants | Chile | 13.6 /100 | #207 | Poor 18.8% |
| Immigrants | Burma/Myanmar | 13.6 /100 | #208 | Poor 18.8% |
| Immigrants | Egypt | 13.5 /100 | #209 | Poor 18.8% |
| Bulgarians | 13.1 /100 | #210 | Poor 18.8% |
| Immigrants | Kenya | 12.4 /100 | #211 | Poor 18.8% |
| Panamanians | 11.6 /100 | #212 | Poor 18.8% |
| Immigrants | Cuba | 11.6 /100 | #213 | Poor 18.8% |
| Immigrants | Sierra Leone | 10.8 /100 | #214 | Poor 18.7% |
| Eastern Europeans | 10.6 /100 | #215 | Poor 18.7% |
| Immigrants | Nigeria | 10.3 /100 | #216 | Poor 18.7% |
| Immigrants | Italy | 10.2 /100 | #217 | Poor 18.7% |
| Immigrants | Portugal | 8.9 /100 | #218 | Tragic 18.6% |