Immigrants from Guatemala vs Immigrants from Kenya In Labor Force | Age 25-29
COMPARE
Immigrants from Guatemala
Immigrants from Kenya
In Labor Force | Age 25-29
In Labor Force | Age 25-29 Comparison
Immigrants from Guatemala
Immigrants from Kenya
83.6%
IN LABOR FORCE | AGE 25-29
0.1/ 100
METRIC RATING
258th/ 347
METRIC RANK
85.4%
IN LABOR FORCE | AGE 25-29
99.4/ 100
METRIC RATING
63rd/ 347
METRIC RANK
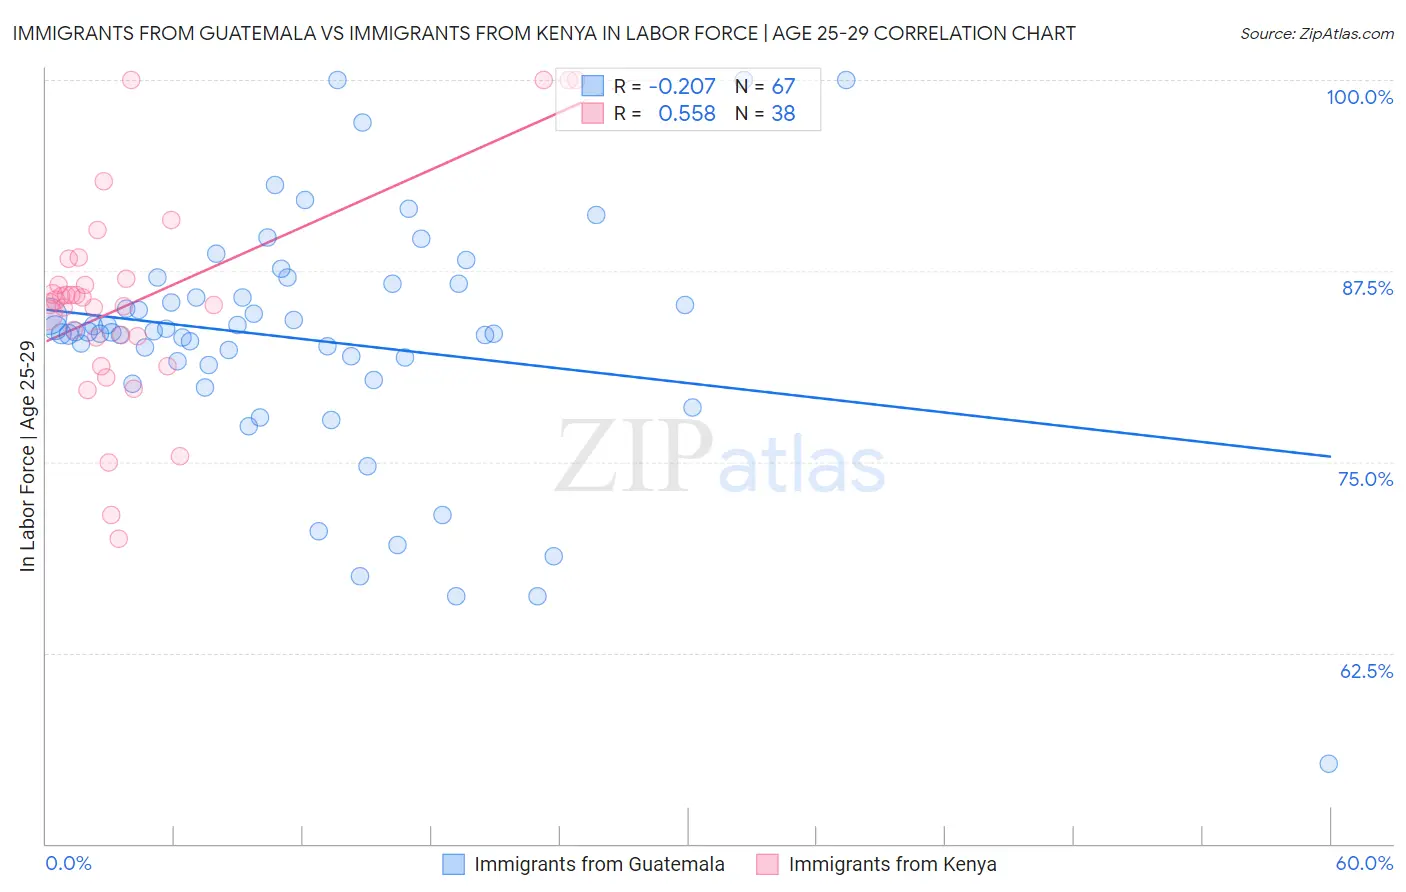
Immigrants from Guatemala vs Immigrants from Kenya In Labor Force | Age 25-29 Correlation Chart
The statistical analysis conducted on geographies consisting of 377,188,709 people shows a weak negative correlation between the proportion of Immigrants from Guatemala and labor force participation rate among population between the ages 25 and 29 in the United States with a correlation coefficient (R) of -0.207 and weighted average of 83.6%. Similarly, the statistical analysis conducted on geographies consisting of 218,069,708 people shows a substantial positive correlation between the proportion of Immigrants from Kenya and labor force participation rate among population between the ages 25 and 29 in the United States with a correlation coefficient (R) of 0.558 and weighted average of 85.4%, a difference of 2.2%.
In Labor Force | Age 25-29 Correlation Summary
| Measurement | Immigrants from Guatemala | Immigrants from Kenya |
| Minimum | 55.2% | 70.0% |
| Maximum | 100.0% | 100.0% |
| Range | 44.8% | 30.0% |
| Mean | 83.0% | 85.5% |
| Median | 83.5% | 85.5% |
| Interquartile 25% (IQ1) | 81.4% | 83.1% |
| Interquartile 75% (IQ3) | 86.6% | 87.0% |
| Interquartile Range (IQR) | 5.3% | 3.9% |
| Standard Deviation (Sample) | 7.9% | 6.9% |
| Standard Deviation (Population) | 7.8% | 6.8% |
Similar Demographics by In Labor Force | Age 25-29
Demographics Similar to Immigrants from Guatemala by In Labor Force | Age 25-29
In terms of in labor force | age 25-29, the demographic groups most similar to Immigrants from Guatemala are Spanish (83.6%, a difference of 0.010%), Immigrants from Bahamas (83.6%, a difference of 0.020%), Pennsylvania German (83.6%, a difference of 0.020%), Delaware (83.7%, a difference of 0.040%), and Immigrants from Haiti (83.7%, a difference of 0.050%).
| Demographics | Rating | Rank | In Labor Force | Age 25-29 |
| Bahamians | 0.2 /100 | #251 | Tragic 83.7% |
| Guatemalans | 0.2 /100 | #252 | Tragic 83.7% |
| Immigrants | Trinidad and Tobago | 0.2 /100 | #253 | Tragic 83.7% |
| Spaniards | 0.2 /100 | #254 | Tragic 83.7% |
| Haitians | 0.2 /100 | #255 | Tragic 83.7% |
| Immigrants | Haiti | 0.2 /100 | #256 | Tragic 83.7% |
| Delaware | 0.2 /100 | #257 | Tragic 83.7% |
| Immigrants | Guatemala | 0.1 /100 | #258 | Tragic 83.6% |
| Spanish | 0.1 /100 | #259 | Tragic 83.6% |
| Immigrants | Bahamas | 0.1 /100 | #260 | Tragic 83.6% |
| Pennsylvania Germans | 0.1 /100 | #261 | Tragic 83.6% |
| Immigrants | Fiji | 0.1 /100 | #262 | Tragic 83.6% |
| West Indians | 0.1 /100 | #263 | Tragic 83.5% |
| Puget Sound Salish | 0.1 /100 | #264 | Tragic 83.5% |
| Cubans | 0.1 /100 | #265 | Tragic 83.5% |
Demographics Similar to Immigrants from Kenya by In Labor Force | Age 25-29
In terms of in labor force | age 25-29, the demographic groups most similar to Immigrants from Kenya are Taiwanese (85.4%, a difference of 0.010%), Thai (85.5%, a difference of 0.020%), Serbian (85.5%, a difference of 0.020%), Immigrants from Italy (85.4%, a difference of 0.020%), and Immigrants from Czechoslovakia (85.4%, a difference of 0.030%).
| Demographics | Rating | Rank | In Labor Force | Age 25-29 |
| Eastern Europeans | 99.6 /100 | #56 | Exceptional 85.5% |
| Estonians | 99.6 /100 | #57 | Exceptional 85.5% |
| Greeks | 99.6 /100 | #58 | Exceptional 85.5% |
| Immigrants | Morocco | 99.5 /100 | #59 | Exceptional 85.5% |
| Thais | 99.5 /100 | #60 | Exceptional 85.5% |
| Serbians | 99.5 /100 | #61 | Exceptional 85.5% |
| Taiwanese | 99.4 /100 | #62 | Exceptional 85.4% |
| Immigrants | Kenya | 99.4 /100 | #63 | Exceptional 85.4% |
| Immigrants | Italy | 99.3 /100 | #64 | Exceptional 85.4% |
| Immigrants | Czechoslovakia | 99.3 /100 | #65 | Exceptional 85.4% |
| Immigrants | Scotland | 99.3 /100 | #66 | Exceptional 85.4% |
| Immigrants | Turkey | 99.2 /100 | #67 | Exceptional 85.4% |
| Immigrants | Cameroon | 99.2 /100 | #68 | Exceptional 85.4% |
| Menominee | 99.1 /100 | #69 | Exceptional 85.4% |
| Immigrants | Sweden | 99.1 /100 | #70 | Exceptional 85.4% |