Ecuadorian vs Immigrants from Kenya 3 or more Vehicles in Household
COMPARE
Ecuadorian
Immigrants from Kenya
3 or more Vehicles in Household
3 or more Vehicles in Household Comparison
Ecuadorians
Immigrants from Kenya
14.1%
3 OR MORE VEHICLES IN HOUSEHOLD
0.0/ 100
METRIC RATING
327th/ 347
METRIC RANK
18.8%
3 OR MORE VEHICLES IN HOUSEHOLD
12.4/ 100
METRIC RATING
211th/ 347
METRIC RANK
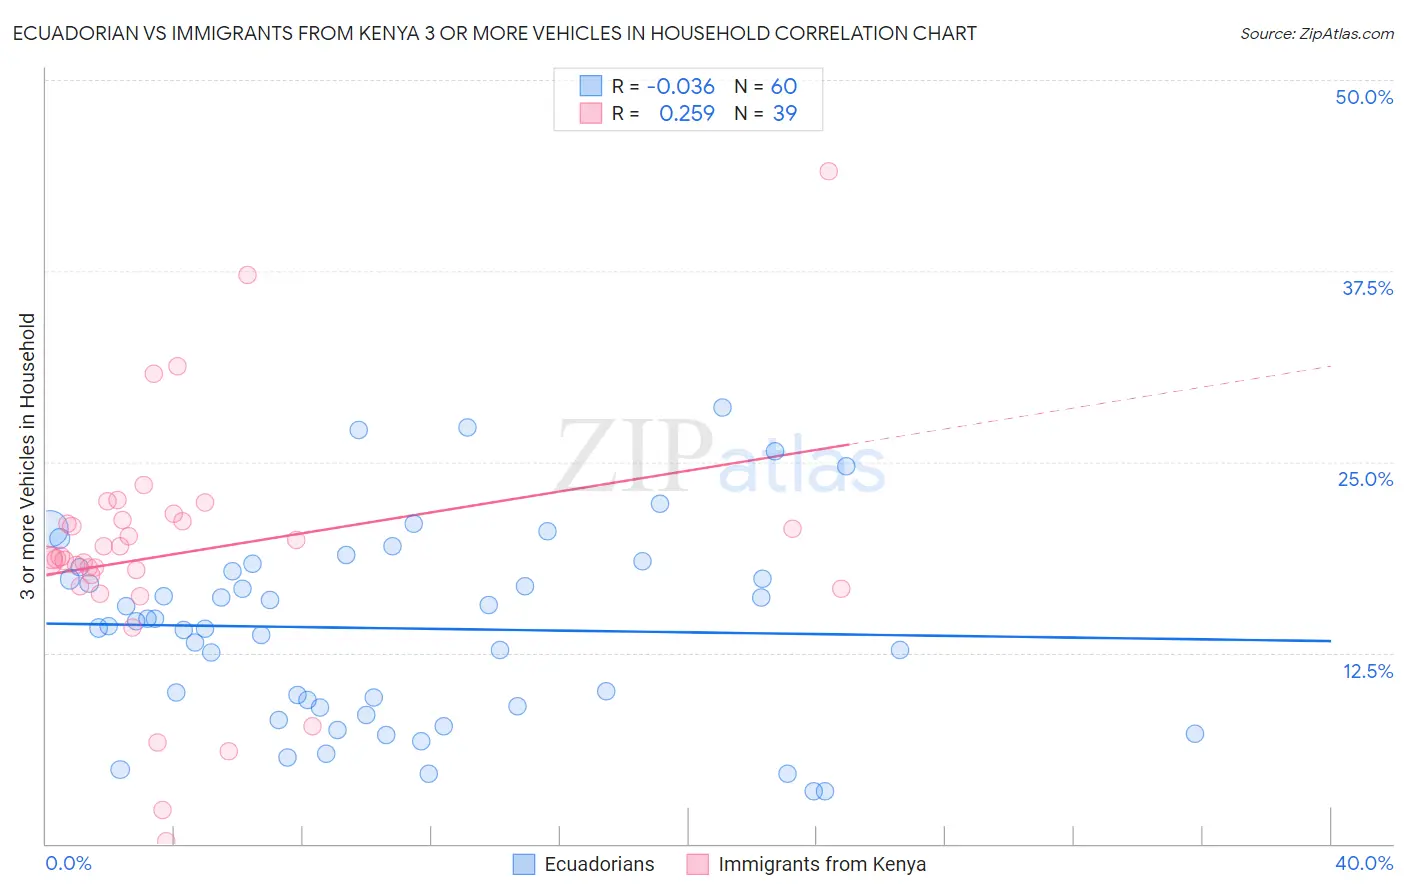
Ecuadorian vs Immigrants from Kenya 3 or more Vehicles in Household Correlation Chart
The statistical analysis conducted on geographies consisting of 317,505,117 people shows no correlation between the proportion of Ecuadorians and percentage of households with 3 or more vehicles available in the United States with a correlation coefficient (R) of -0.036 and weighted average of 14.1%. Similarly, the statistical analysis conducted on geographies consisting of 217,959,739 people shows a weak positive correlation between the proportion of Immigrants from Kenya and percentage of households with 3 or more vehicles available in the United States with a correlation coefficient (R) of 0.259 and weighted average of 18.8%, a difference of 33.6%.
3 or more Vehicles in Household Correlation Summary
| Measurement | Ecuadorian | Immigrants from Kenya |
| Minimum | 3.4% | 0.19% |
| Maximum | 28.5% | 44.0% |
| Range | 25.1% | 43.8% |
| Mean | 14.1% | 19.1% |
| Median | 14.4% | 18.7% |
| Interquartile 25% (IQ1) | 8.9% | 16.9% |
| Interquartile 75% (IQ3) | 18.0% | 21.2% |
| Interquartile Range (IQR) | 9.1% | 4.3% |
| Standard Deviation (Sample) | 6.3% | 8.1% |
| Standard Deviation (Population) | 6.2% | 8.0% |
Similar Demographics by 3 or more Vehicles in Household
Demographics Similar to Ecuadorians by 3 or more Vehicles in Household
In terms of 3 or more vehicles in household, the demographic groups most similar to Ecuadorians are Immigrants from Albania (14.0%, a difference of 0.71%), Soviet Union (14.2%, a difference of 0.89%), Senegalese (14.2%, a difference of 1.2%), Immigrants from Yemen (14.2%, a difference of 1.3%), and Immigrants from Senegal (13.8%, a difference of 1.9%).
| Demographics | Rating | Rank | 3 or more Vehicles in Household |
| Yup'ik | 0.0 /100 | #320 | Tragic 14.8% |
| Immigrants | Jamaica | 0.0 /100 | #321 | Tragic 14.7% |
| Immigrants | West Indies | 0.0 /100 | #322 | Tragic 14.6% |
| Immigrants | Caribbean | 0.0 /100 | #323 | Tragic 14.6% |
| Immigrants | Yemen | 0.0 /100 | #324 | Tragic 14.2% |
| Senegalese | 0.0 /100 | #325 | Tragic 14.2% |
| Soviet Union | 0.0 /100 | #326 | Tragic 14.2% |
| Ecuadorians | 0.0 /100 | #327 | Tragic 14.1% |
| Immigrants | Albania | 0.0 /100 | #328 | Tragic 14.0% |
| Immigrants | Senegal | 0.0 /100 | #329 | Tragic 13.8% |
| West Indians | 0.0 /100 | #330 | Tragic 13.7% |
| Immigrants | Dominica | 0.0 /100 | #331 | Tragic 13.7% |
| Trinidadians and Tobagonians | 0.0 /100 | #332 | Tragic 13.6% |
| Immigrants | Cabo Verde | 0.0 /100 | #333 | Tragic 13.6% |
| Immigrants | Ecuador | 0.0 /100 | #334 | Tragic 13.4% |
Demographics Similar to Immigrants from Kenya by 3 or more Vehicles in Household
In terms of 3 or more vehicles in household, the demographic groups most similar to Immigrants from Kenya are Bulgarian (18.8%, a difference of 0.12%), Panamanian (18.8%, a difference of 0.14%), Immigrants from Cuba (18.8%, a difference of 0.15%), Immigrants from Egypt (18.8%, a difference of 0.20%), and Immigrants from Chile (18.8%, a difference of 0.21%).
| Demographics | Rating | Rank | 3 or more Vehicles in Household |
| Immigrants | Romania | 14.6 /100 | #204 | Poor 18.9% |
| Russians | 14.2 /100 | #205 | Poor 18.8% |
| Immigrants | Eastern Asia | 14.1 /100 | #206 | Poor 18.8% |
| Immigrants | Chile | 13.6 /100 | #207 | Poor 18.8% |
| Immigrants | Burma/Myanmar | 13.6 /100 | #208 | Poor 18.8% |
| Immigrants | Egypt | 13.5 /100 | #209 | Poor 18.8% |
| Bulgarians | 13.1 /100 | #210 | Poor 18.8% |
| Immigrants | Kenya | 12.4 /100 | #211 | Poor 18.8% |
| Panamanians | 11.6 /100 | #212 | Poor 18.8% |
| Immigrants | Cuba | 11.6 /100 | #213 | Poor 18.8% |
| Immigrants | Sierra Leone | 10.8 /100 | #214 | Poor 18.7% |
| Eastern Europeans | 10.6 /100 | #215 | Poor 18.7% |
| Immigrants | Nigeria | 10.3 /100 | #216 | Poor 18.7% |
| Immigrants | Italy | 10.2 /100 | #217 | Poor 18.7% |
| Immigrants | Portugal | 8.9 /100 | #218 | Tragic 18.6% |