Immigrants from Bolivia vs South American Indian 1 or more Vehicles in Household
COMPARE
Immigrants from Bolivia
South American Indian
1 or more Vehicles in Household
1 or more Vehicles in Household Comparison
Immigrants from Bolivia
South American Indians
91.2%
1 OR MORE VEHICLES IN HOUSEHOLD
98.6/ 100
METRIC RATING
99th/ 347
METRIC RANK
88.0%
1 OR MORE VEHICLES IN HOUSEHOLD
0.9/ 100
METRIC RATING
258th/ 347
METRIC RANK
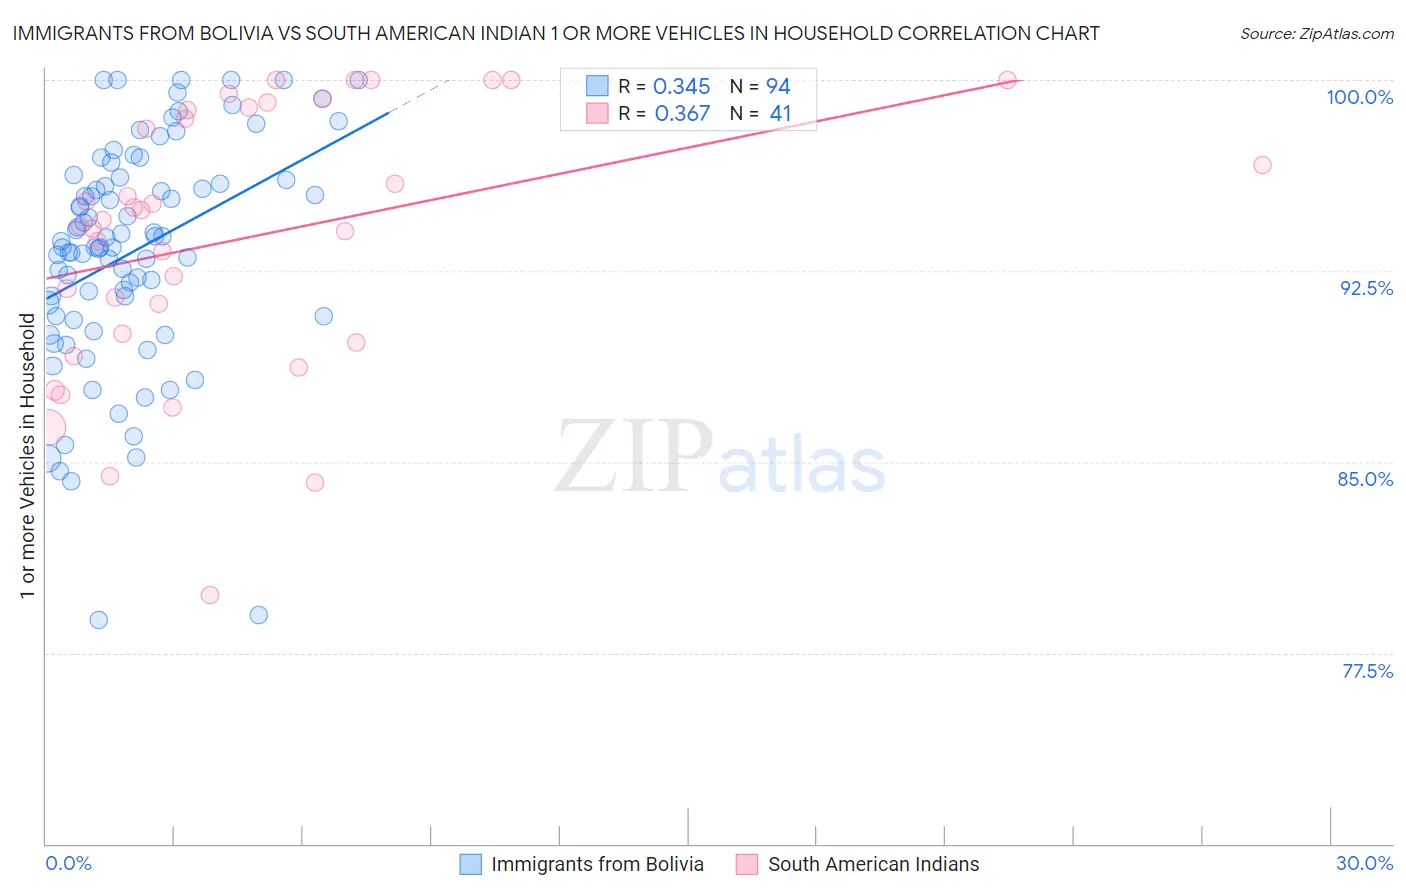
Immigrants from Bolivia vs South American Indian 1 or more Vehicles in Household Correlation Chart
The statistical analysis conducted on geographies consisting of 158,721,920 people shows a mild positive correlation between the proportion of Immigrants from Bolivia and percentage of households with 1 or more vehicles available in the United States with a correlation coefficient (R) of 0.345 and weighted average of 91.2%. Similarly, the statistical analysis conducted on geographies consisting of 164,540,397 people shows a mild positive correlation between the proportion of South American Indians and percentage of households with 1 or more vehicles available in the United States with a correlation coefficient (R) of 0.367 and weighted average of 88.0%, a difference of 3.6%.
1 or more Vehicles in Household Correlation Summary
| Measurement | Immigrants from Bolivia | South American Indian |
| Minimum | 78.8% | 79.8% |
| Maximum | 100.0% | 100.0% |
| Range | 21.2% | 20.2% |
| Mean | 93.3% | 93.8% |
| Median | 93.5% | 94.5% |
| Interquartile 25% (IQ1) | 90.7% | 89.9% |
| Interquartile 75% (IQ3) | 96.1% | 98.9% |
| Interquartile Range (IQR) | 5.4% | 9.0% |
| Standard Deviation (Sample) | 4.4% | 5.2% |
| Standard Deviation (Population) | 4.4% | 5.1% |
Similar Demographics by 1 or more Vehicles in Household
Demographics Similar to Immigrants from Bolivia by 1 or more Vehicles in Household
In terms of 1 or more vehicles in household, the demographic groups most similar to Immigrants from Bolivia are Slavic (91.2%, a difference of 0.020%), Immigrants from Central America (91.1%, a difference of 0.040%), Bulgarian (91.1%, a difference of 0.050%), Seminole (91.1%, a difference of 0.070%), and Yugoslavian (91.1%, a difference of 0.080%).
| Demographics | Rating | Rank | 1 or more Vehicles in Household |
| Bhutanese | 99.2 /100 | #92 | Exceptional 91.4% |
| Immigrants | North America | 99.2 /100 | #93 | Exceptional 91.4% |
| Immigrants | Cuba | 99.1 /100 | #94 | Exceptional 91.3% |
| Austrians | 99.0 /100 | #95 | Exceptional 91.3% |
| Potawatomi | 99.0 /100 | #96 | Exceptional 91.3% |
| Pakistanis | 99.0 /100 | #97 | Exceptional 91.3% |
| Slavs | 98.7 /100 | #98 | Exceptional 91.2% |
| Immigrants | Bolivia | 98.6 /100 | #99 | Exceptional 91.2% |
| Immigrants | Central America | 98.4 /100 | #100 | Exceptional 91.1% |
| Bulgarians | 98.4 /100 | #101 | Exceptional 91.1% |
| Seminole | 98.3 /100 | #102 | Exceptional 91.1% |
| Yugoslavians | 98.3 /100 | #103 | Exceptional 91.1% |
| Asians | 98.2 /100 | #104 | Exceptional 91.1% |
| Laotians | 98.0 /100 | #105 | Exceptional 91.0% |
| Zimbabweans | 97.7 /100 | #106 | Exceptional 91.0% |
Demographics Similar to South American Indians by 1 or more Vehicles in Household
In terms of 1 or more vehicles in household, the demographic groups most similar to South American Indians are Liberian (88.0%, a difference of 0.0%), Immigrants from Latvia (88.1%, a difference of 0.010%), Colombian (88.0%, a difference of 0.010%), Nigerian (88.0%, a difference of 0.030%), and Honduran (88.1%, a difference of 0.040%).
| Demographics | Rating | Rank | 1 or more Vehicles in Household |
| Immigrants | Serbia | 1.2 /100 | #251 | Tragic 88.2% |
| Immigrants | Uruguay | 1.1 /100 | #252 | Tragic 88.1% |
| Hondurans | 1.0 /100 | #253 | Tragic 88.1% |
| Haitians | 0.9 /100 | #254 | Tragic 88.1% |
| Immigrants | Latvia | 0.9 /100 | #255 | Tragic 88.1% |
| Colombians | 0.9 /100 | #256 | Tragic 88.0% |
| Liberians | 0.9 /100 | #257 | Tragic 88.0% |
| South American Indians | 0.9 /100 | #258 | Tragic 88.0% |
| Nigerians | 0.8 /100 | #259 | Tragic 88.0% |
| Macedonians | 0.6 /100 | #260 | Tragic 87.9% |
| Immigrants | Switzerland | 0.6 /100 | #261 | Tragic 87.9% |
| Sub-Saharan Africans | 0.5 /100 | #262 | Tragic 87.9% |
| Immigrants | Egypt | 0.5 /100 | #263 | Tragic 87.8% |
| Immigrants | Liberia | 0.4 /100 | #264 | Tragic 87.8% |
| Africans | 0.4 /100 | #265 | Tragic 87.8% |