Native Hawaiian vs South American Indian 1 or more Vehicles in Household
COMPARE
Native Hawaiian
South American Indian
1 or more Vehicles in Household
1 or more Vehicles in Household Comparison
Native Hawaiians
South American Indians
92.4%
1 OR MORE VEHICLES IN HOUSEHOLD
100.0/ 100
METRIC RATING
29th/ 347
METRIC RANK
88.0%
1 OR MORE VEHICLES IN HOUSEHOLD
0.9/ 100
METRIC RATING
258th/ 347
METRIC RANK
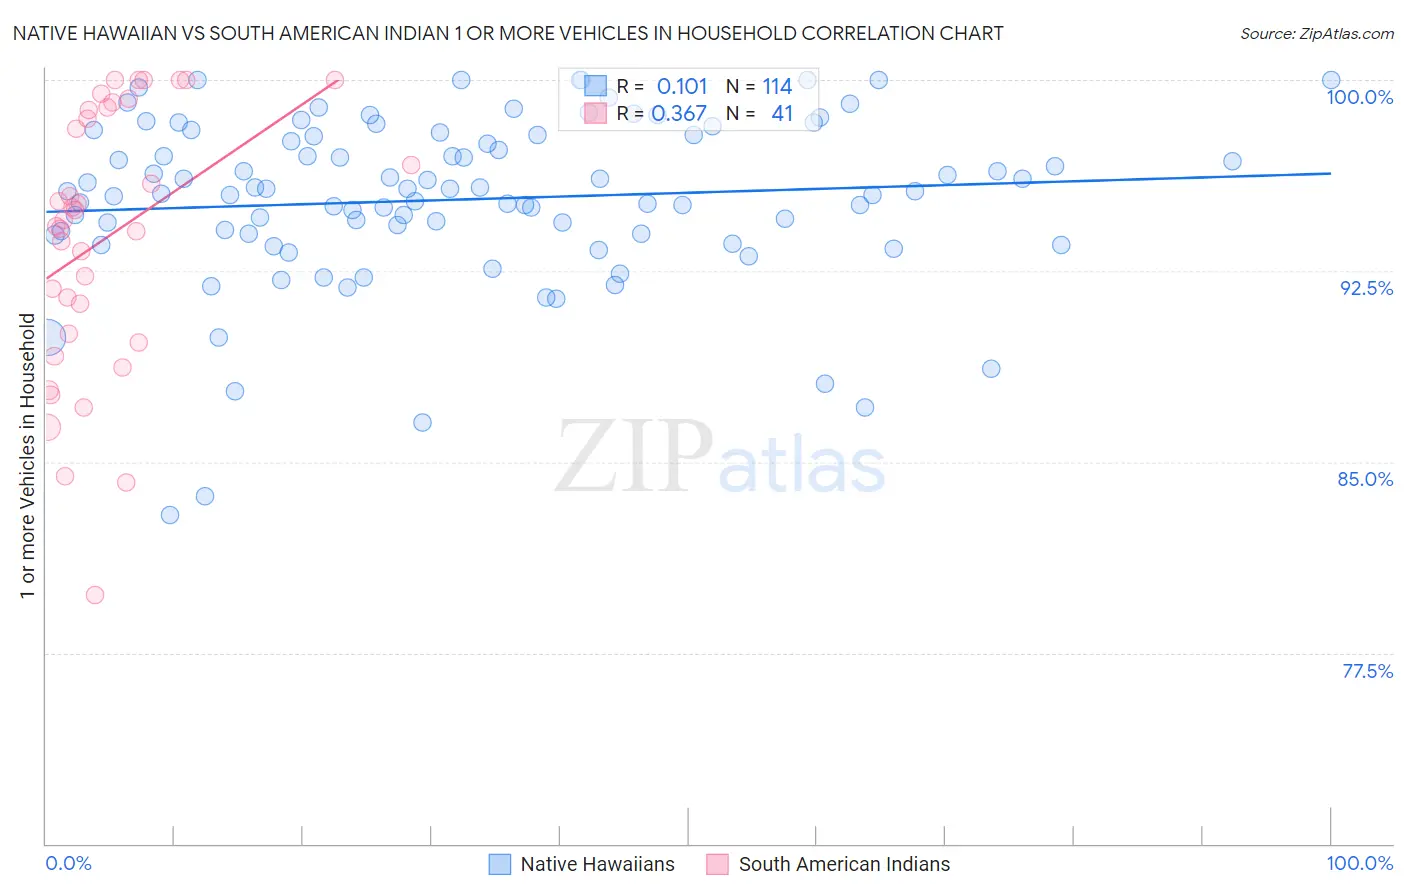
Native Hawaiian vs South American Indian 1 or more Vehicles in Household Correlation Chart
The statistical analysis conducted on geographies consisting of 331,859,591 people shows a poor positive correlation between the proportion of Native Hawaiians and percentage of households with 1 or more vehicles available in the United States with a correlation coefficient (R) of 0.101 and weighted average of 92.4%. Similarly, the statistical analysis conducted on geographies consisting of 164,540,397 people shows a mild positive correlation between the proportion of South American Indians and percentage of households with 1 or more vehicles available in the United States with a correlation coefficient (R) of 0.367 and weighted average of 88.0%, a difference of 5.0%.
1 or more Vehicles in Household Correlation Summary
| Measurement | Native Hawaiian | South American Indian |
| Minimum | 82.9% | 79.8% |
| Maximum | 100.0% | 100.0% |
| Range | 17.1% | 20.2% |
| Mean | 95.3% | 93.8% |
| Median | 95.6% | 94.5% |
| Interquartile 25% (IQ1) | 93.9% | 89.9% |
| Interquartile 75% (IQ3) | 97.8% | 98.9% |
| Interquartile Range (IQR) | 3.9% | 9.0% |
| Standard Deviation (Sample) | 3.3% | 5.2% |
| Standard Deviation (Population) | 3.3% | 5.1% |
Similar Demographics by 1 or more Vehicles in Household
Demographics Similar to Native Hawaiians by 1 or more Vehicles in Household
In terms of 1 or more vehicles in household, the demographic groups most similar to Native Hawaiians are Finnish (92.4%, a difference of 0.0%), Sri Lankan (92.5%, a difference of 0.010%), Samoan (92.4%, a difference of 0.010%), American (92.5%, a difference of 0.050%), and Basque (92.4%, a difference of 0.050%).
| Demographics | Rating | Rank | 1 or more Vehicles in Household |
| French | 100.0 /100 | #22 | Exceptional 92.7% |
| Nepalese | 100.0 /100 | #23 | Exceptional 92.6% |
| Yaqui | 100.0 /100 | #24 | Exceptional 92.6% |
| Immigrants | Iraq | 100.0 /100 | #25 | Exceptional 92.5% |
| British | 100.0 /100 | #26 | Exceptional 92.5% |
| Americans | 100.0 /100 | #27 | Exceptional 92.5% |
| Sri Lankans | 100.0 /100 | #28 | Exceptional 92.5% |
| Native Hawaiians | 100.0 /100 | #29 | Exceptional 92.4% |
| Finns | 100.0 /100 | #30 | Exceptional 92.4% |
| Samoans | 100.0 /100 | #31 | Exceptional 92.4% |
| Basques | 100.0 /100 | #32 | Exceptional 92.4% |
| Cherokee | 100.0 /100 | #33 | Exceptional 92.4% |
| Italians | 99.9 /100 | #34 | Exceptional 92.3% |
| Czechoslovakians | 99.9 /100 | #35 | Exceptional 92.3% |
| Malaysians | 99.9 /100 | #36 | Exceptional 92.3% |
Demographics Similar to South American Indians by 1 or more Vehicles in Household
In terms of 1 or more vehicles in household, the demographic groups most similar to South American Indians are Liberian (88.0%, a difference of 0.0%), Immigrants from Latvia (88.1%, a difference of 0.010%), Colombian (88.0%, a difference of 0.010%), Nigerian (88.0%, a difference of 0.030%), and Honduran (88.1%, a difference of 0.040%).
| Demographics | Rating | Rank | 1 or more Vehicles in Household |
| Immigrants | Serbia | 1.2 /100 | #251 | Tragic 88.2% |
| Immigrants | Uruguay | 1.1 /100 | #252 | Tragic 88.1% |
| Hondurans | 1.0 /100 | #253 | Tragic 88.1% |
| Haitians | 0.9 /100 | #254 | Tragic 88.1% |
| Immigrants | Latvia | 0.9 /100 | #255 | Tragic 88.1% |
| Colombians | 0.9 /100 | #256 | Tragic 88.0% |
| Liberians | 0.9 /100 | #257 | Tragic 88.0% |
| South American Indians | 0.9 /100 | #258 | Tragic 88.0% |
| Nigerians | 0.8 /100 | #259 | Tragic 88.0% |
| Macedonians | 0.6 /100 | #260 | Tragic 87.9% |
| Immigrants | Switzerland | 0.6 /100 | #261 | Tragic 87.9% |
| Sub-Saharan Africans | 0.5 /100 | #262 | Tragic 87.9% |
| Immigrants | Egypt | 0.5 /100 | #263 | Tragic 87.8% |
| Immigrants | Liberia | 0.4 /100 | #264 | Tragic 87.8% |
| Africans | 0.4 /100 | #265 | Tragic 87.8% |