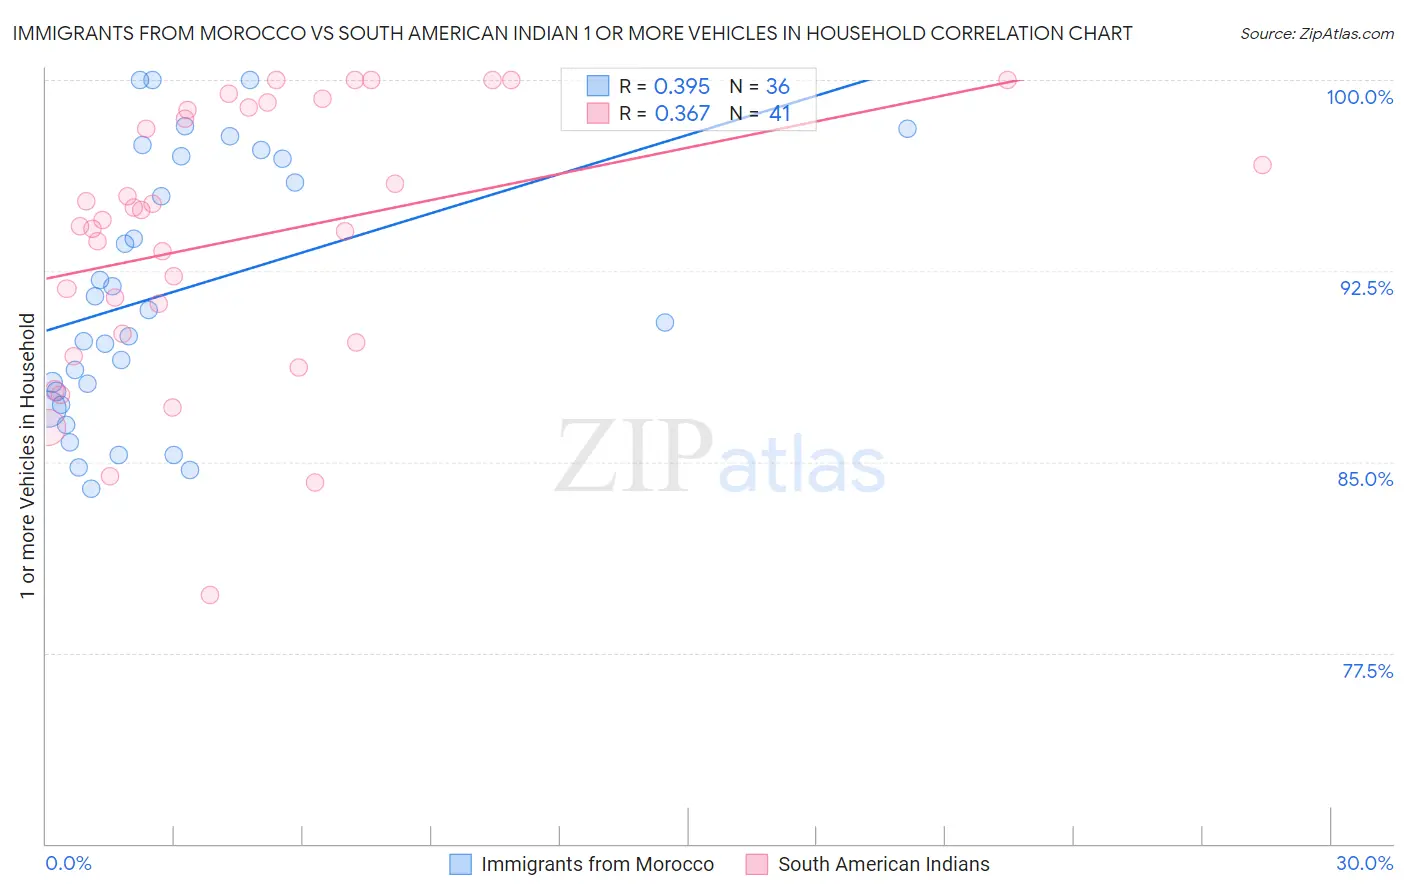
Immigrants from Morocco vs South American Indian 1 or more Vehicles in Household
COMPARE
Immigrants from Morocco
South American Indian
1 or more Vehicles in Household
1 or more Vehicles in Household Comparison
Immigrants from Morocco
South American Indians
87.4%
1 OR MORE VEHICLES IN HOUSEHOLD
0.1/ 100
METRIC RATING
274th/ 347
METRIC RANK
88.0%
1 OR MORE VEHICLES IN HOUSEHOLD
0.9/ 100
METRIC RATING
258th/ 347
METRIC RANK
Immigrants from Morocco vs South American Indian 1 or more Vehicles in Household Correlation Chart
The statistical analysis conducted on geographies consisting of 178,835,881 people shows a mild positive correlation between the proportion of Immigrants from Morocco and percentage of households with 1 or more vehicles available in the United States with a correlation coefficient (R) of 0.395 and weighted average of 87.4%. Similarly, the statistical analysis conducted on geographies consisting of 164,540,397 people shows a mild positive correlation between the proportion of South American Indians and percentage of households with 1 or more vehicles available in the United States with a correlation coefficient (R) of 0.367 and weighted average of 88.0%, a difference of 0.71%.
1 or more Vehicles in Household Correlation Summary
| Measurement | Immigrants from Morocco | South American Indian |
| Minimum | 84.0% | 79.8% |
| Maximum | 100.0% | 100.0% |
| Range | 16.0% | 20.2% |
| Mean | 91.7% | 93.8% |
| Median | 90.7% | 94.5% |
| Interquartile 25% (IQ1) | 87.5% | 89.9% |
| Interquartile 75% (IQ3) | 96.9% | 98.9% |
| Interquartile Range (IQR) | 9.5% | 9.0% |
| Standard Deviation (Sample) | 5.1% | 5.2% |
| Standard Deviation (Population) | 5.0% | 5.1% |
Demographics Similar to Immigrants from Morocco and South American Indians by 1 or more Vehicles in Household
In terms of 1 or more vehicles in household, the demographic groups most similar to Immigrants from Morocco are Immigrants from Northern Africa (87.4%, a difference of 0.030%), Aleut (87.5%, a difference of 0.080%), Bermudan (87.5%, a difference of 0.14%), Panamanian (87.5%, a difference of 0.15%), and Immigrants from Africa (87.6%, a difference of 0.16%). Similarly, the demographic groups most similar to South American Indians are Liberian (88.0%, a difference of 0.0%), Colombian (88.0%, a difference of 0.010%), Nigerian (88.0%, a difference of 0.030%), Macedonian (87.9%, a difference of 0.12%), and Immigrants from Switzerland (87.9%, a difference of 0.16%).
| Demographics | Rating | Rank | 1 or more Vehicles in Household |
| Colombians | 0.9 /100 | #256 | Tragic 88.0% |
| Liberians | 0.9 /100 | #257 | Tragic 88.0% |
| South American Indians | 0.9 /100 | #258 | Tragic 88.0% |
| Nigerians | 0.8 /100 | #259 | Tragic 88.0% |
| Macedonians | 0.6 /100 | #260 | Tragic 87.9% |
| Immigrants | Switzerland | 0.6 /100 | #261 | Tragic 87.9% |
| Sub-Saharan Africans | 0.5 /100 | #262 | Tragic 87.9% |
| Immigrants | Egypt | 0.5 /100 | #263 | Tragic 87.8% |
| Immigrants | Liberia | 0.4 /100 | #264 | Tragic 87.8% |
| Africans | 0.4 /100 | #265 | Tragic 87.8% |
| Israelis | 0.3 /100 | #266 | Tragic 87.7% |
| Immigrants | Colombia | 0.3 /100 | #267 | Tragic 87.6% |
| Immigrants | Europe | 0.2 /100 | #268 | Tragic 87.6% |
| Immigrants | Africa | 0.2 /100 | #269 | Tragic 87.6% |
| Panamanians | 0.2 /100 | #270 | Tragic 87.5% |
| Bermudans | 0.2 /100 | #271 | Tragic 87.5% |
| Aleuts | 0.2 /100 | #272 | Tragic 87.5% |
| Immigrants | Northern Africa | 0.2 /100 | #273 | Tragic 87.4% |
| Immigrants | Morocco | 0.1 /100 | #274 | Tragic 87.4% |
| Immigrants | Singapore | 0.1 /100 | #275 | Tragic 87.2% |
| Immigrants | France | 0.1 /100 | #276 | Tragic 87.1% |