Immigrants from Eastern Asia vs Immigrants from Scotland 3 or more Vehicles in Household
COMPARE
Immigrants from Eastern Asia
Immigrants from Scotland
3 or more Vehicles in Household
3 or more Vehicles in Household Comparison
Immigrants from Eastern Asia
Immigrants from Scotland
18.8%
3 OR MORE VEHICLES IN HOUSEHOLD
14.1/ 100
METRIC RATING
206th/ 347
METRIC RANK
20.8%
3 OR MORE VEHICLES IN HOUSEHOLD
97.1/ 100
METRIC RATING
108th/ 347
METRIC RANK
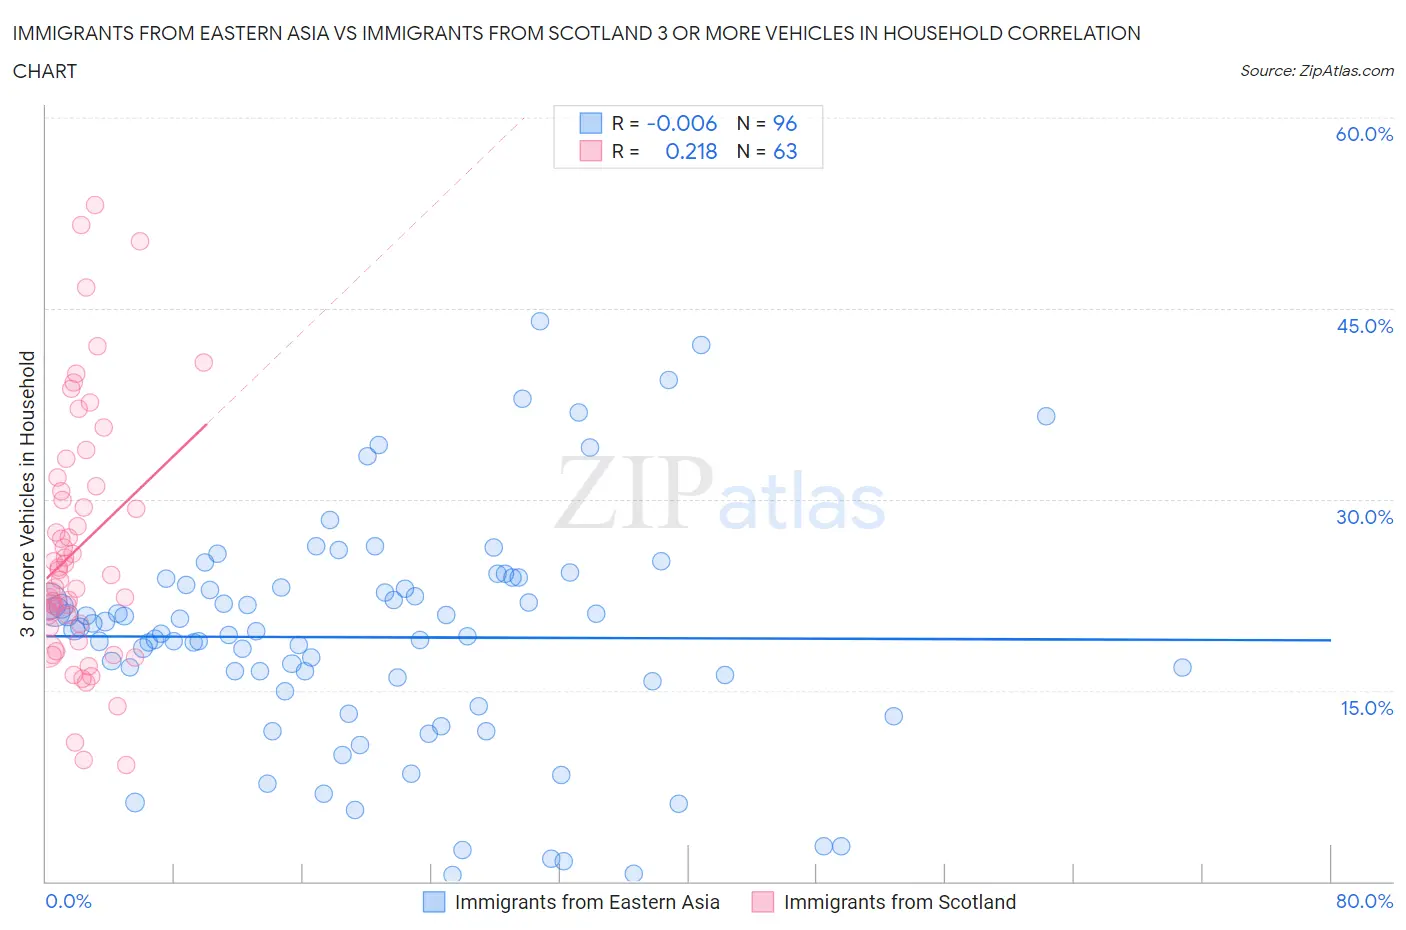
Immigrants from Eastern Asia vs Immigrants from Scotland 3 or more Vehicles in Household Correlation Chart
The statistical analysis conducted on geographies consisting of 499,168,797 people shows no correlation between the proportion of Immigrants from Eastern Asia and percentage of households with 3 or more vehicles available in the United States with a correlation coefficient (R) of -0.006 and weighted average of 18.8%. Similarly, the statistical analysis conducted on geographies consisting of 196,362,918 people shows a weak positive correlation between the proportion of Immigrants from Scotland and percentage of households with 3 or more vehicles available in the United States with a correlation coefficient (R) of 0.218 and weighted average of 20.8%, a difference of 10.4%.
3 or more Vehicles in Household Correlation Summary
| Measurement | Immigrants from Eastern Asia | Immigrants from Scotland |
| Minimum | 0.54% | 9.1% |
| Maximum | 44.0% | 53.1% |
| Range | 43.5% | 44.0% |
| Mean | 19.2% | 26.2% |
| Median | 19.5% | 24.0% |
| Interquartile 25% (IQ1) | 15.3% | 19.9% |
| Interquartile 75% (IQ3) | 23.2% | 31.0% |
| Interquartile Range (IQR) | 7.9% | 11.1% |
| Standard Deviation (Sample) | 8.9% | 9.9% |
| Standard Deviation (Population) | 8.9% | 9.8% |
Similar Demographics by 3 or more Vehicles in Household
Demographics Similar to Immigrants from Eastern Asia by 3 or more Vehicles in Household
In terms of 3 or more vehicles in household, the demographic groups most similar to Immigrants from Eastern Asia are Russian (18.8%, a difference of 0.010%), Immigrants from Romania (18.9%, a difference of 0.080%), Immigrants from Chile (18.8%, a difference of 0.080%), Immigrants from Burma/Myanmar (18.8%, a difference of 0.090%), and Immigrants from Egypt (18.8%, a difference of 0.10%).
| Demographics | Rating | Rank | 3 or more Vehicles in Household |
| Immigrants | Norway | 19.0 /100 | #199 | Poor 19.0% |
| Argentineans | 18.2 /100 | #200 | Poor 18.9% |
| Arabs | 17.7 /100 | #201 | Poor 18.9% |
| Immigrants | Austria | 15.4 /100 | #202 | Poor 18.9% |
| Tohono O'odham | 14.8 /100 | #203 | Poor 18.9% |
| Immigrants | Romania | 14.6 /100 | #204 | Poor 18.9% |
| Russians | 14.2 /100 | #205 | Poor 18.8% |
| Immigrants | Eastern Asia | 14.1 /100 | #206 | Poor 18.8% |
| Immigrants | Chile | 13.6 /100 | #207 | Poor 18.8% |
| Immigrants | Burma/Myanmar | 13.6 /100 | #208 | Poor 18.8% |
| Immigrants | Egypt | 13.5 /100 | #209 | Poor 18.8% |
| Bulgarians | 13.1 /100 | #210 | Poor 18.8% |
| Immigrants | Kenya | 12.4 /100 | #211 | Poor 18.8% |
| Panamanians | 11.6 /100 | #212 | Poor 18.8% |
| Immigrants | Cuba | 11.6 /100 | #213 | Poor 18.8% |
Demographics Similar to Immigrants from Scotland by 3 or more Vehicles in Household
In terms of 3 or more vehicles in household, the demographic groups most similar to Immigrants from Scotland are Filipino (20.8%, a difference of 0.060%), Immigrants from Germany (20.8%, a difference of 0.15%), Bolivian (20.8%, a difference of 0.19%), Asian (20.8%, a difference of 0.20%), and Immigrants from Micronesia (20.7%, a difference of 0.23%).
| Demographics | Rating | Rank | 3 or more Vehicles in Household |
| Blackfeet | 97.9 /100 | #101 | Exceptional 20.9% |
| Seminole | 97.8 /100 | #102 | Exceptional 20.9% |
| Dutch West Indians | 97.8 /100 | #103 | Exceptional 20.9% |
| Luxembourgers | 97.7 /100 | #104 | Exceptional 20.9% |
| Austrians | 97.5 /100 | #105 | Exceptional 20.9% |
| Bolivians | 97.4 /100 | #106 | Exceptional 20.8% |
| Immigrants | Germany | 97.4 /100 | #107 | Exceptional 20.8% |
| Immigrants | Scotland | 97.1 /100 | #108 | Exceptional 20.8% |
| Filipinos | 97.0 /100 | #109 | Exceptional 20.8% |
| Asians | 96.8 /100 | #110 | Exceptional 20.8% |
| Immigrants | Micronesia | 96.7 /100 | #111 | Exceptional 20.7% |
| Nicaraguans | 96.2 /100 | #112 | Exceptional 20.7% |
| Immigrants | England | 96.2 /100 | #113 | Exceptional 20.7% |
| Burmese | 95.8 /100 | #114 | Exceptional 20.6% |
| French Canadians | 95.0 /100 | #115 | Exceptional 20.6% |