Immigrants from Eastern Asia vs Immigrants from Hungary 3 or more Vehicles in Household
COMPARE
Immigrants from Eastern Asia
Immigrants from Hungary
3 or more Vehicles in Household
3 or more Vehicles in Household Comparison
Immigrants from Eastern Asia
Immigrants from Hungary
18.8%
3 OR MORE VEHICLES IN HOUSEHOLD
14.1/ 100
METRIC RATING
206th/ 347
METRIC RANK
18.5%
3 OR MORE VEHICLES IN HOUSEHOLD
5.5/ 100
METRIC RATING
226th/ 347
METRIC RANK
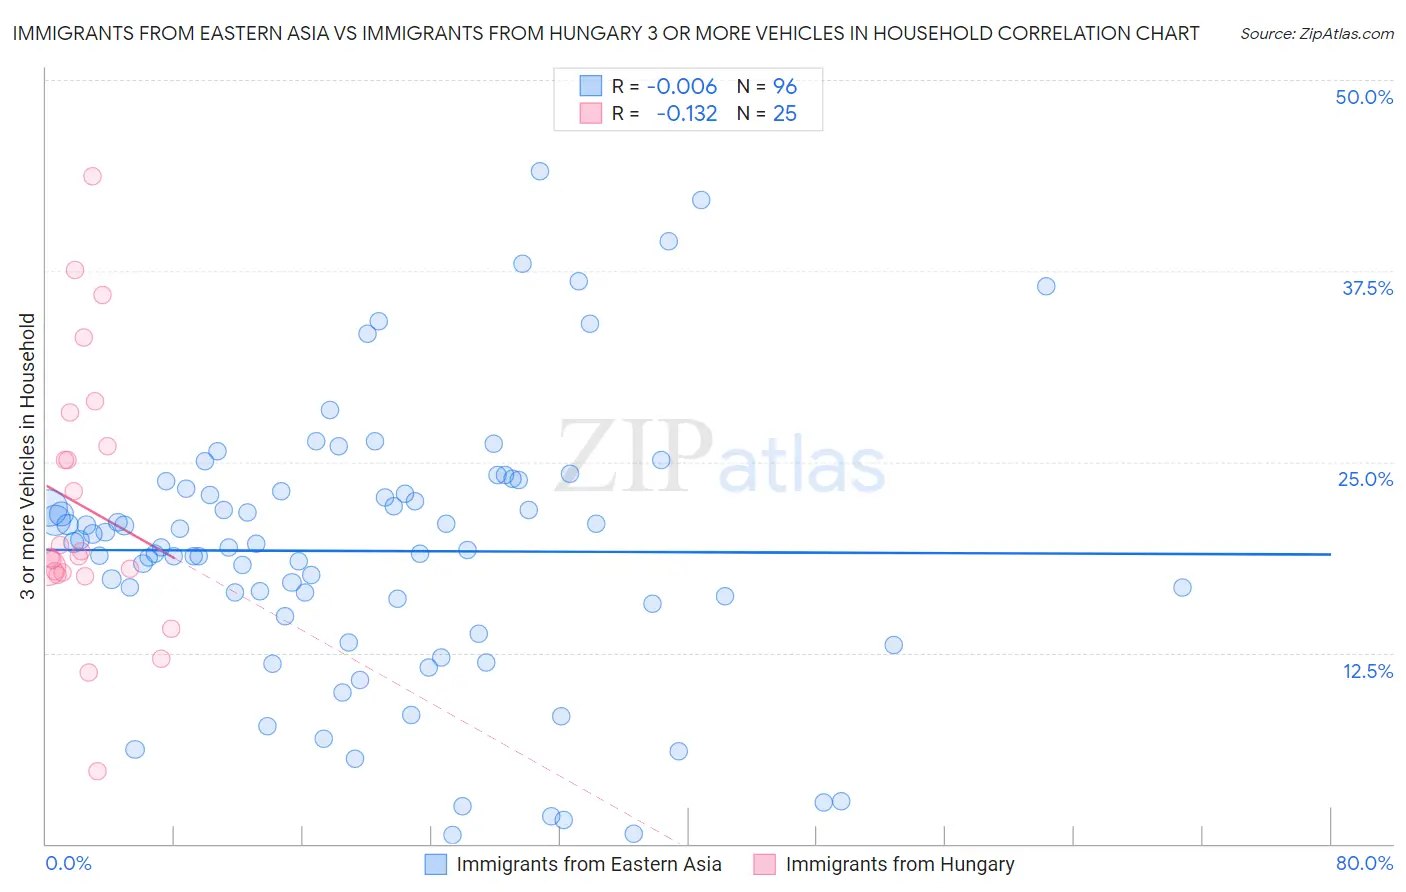
Immigrants from Eastern Asia vs Immigrants from Hungary 3 or more Vehicles in Household Correlation Chart
The statistical analysis conducted on geographies consisting of 499,168,797 people shows no correlation between the proportion of Immigrants from Eastern Asia and percentage of households with 3 or more vehicles available in the United States with a correlation coefficient (R) of -0.006 and weighted average of 18.8%. Similarly, the statistical analysis conducted on geographies consisting of 195,641,507 people shows a poor negative correlation between the proportion of Immigrants from Hungary and percentage of households with 3 or more vehicles available in the United States with a correlation coefficient (R) of -0.132 and weighted average of 18.5%, a difference of 2.1%.
3 or more Vehicles in Household Correlation Summary
| Measurement | Immigrants from Eastern Asia | Immigrants from Hungary |
| Minimum | 0.54% | 4.8% |
| Maximum | 44.0% | 43.7% |
| Range | 43.5% | 39.0% |
| Mean | 19.2% | 22.0% |
| Median | 19.5% | 18.9% |
| Interquartile 25% (IQ1) | 15.3% | 17.7% |
| Interquartile 75% (IQ3) | 23.2% | 27.1% |
| Interquartile Range (IQR) | 7.9% | 9.4% |
| Standard Deviation (Sample) | 8.9% | 8.8% |
| Standard Deviation (Population) | 8.9% | 8.7% |
Demographics Similar to Immigrants from Eastern Asia and Immigrants from Hungary by 3 or more Vehicles in Household
In terms of 3 or more vehicles in household, the demographic groups most similar to Immigrants from Eastern Asia are Immigrants from Chile (18.8%, a difference of 0.080%), Immigrants from Burma/Myanmar (18.8%, a difference of 0.090%), Immigrants from Egypt (18.8%, a difference of 0.10%), Bulgarian (18.8%, a difference of 0.17%), and Immigrants from Kenya (18.8%, a difference of 0.29%). Similarly, the demographic groups most similar to Immigrants from Hungary are Immigrants from Lithuania (18.5%, a difference of 0.030%), Immigrants from Argentina (18.5%, a difference of 0.040%), Immigrants from Czechoslovakia (18.5%, a difference of 0.15%), Belizean (18.6%, a difference of 0.62%), and Immigrants from Poland (18.6%, a difference of 0.67%).
| Demographics | Rating | Rank | 3 or more Vehicles in Household |
| Immigrants | Eastern Asia | 14.1 /100 | #206 | Poor 18.8% |
| Immigrants | Chile | 13.6 /100 | #207 | Poor 18.8% |
| Immigrants | Burma/Myanmar | 13.6 /100 | #208 | Poor 18.8% |
| Immigrants | Egypt | 13.5 /100 | #209 | Poor 18.8% |
| Bulgarians | 13.1 /100 | #210 | Poor 18.8% |
| Immigrants | Kenya | 12.4 /100 | #211 | Poor 18.8% |
| Panamanians | 11.6 /100 | #212 | Poor 18.8% |
| Immigrants | Cuba | 11.6 /100 | #213 | Poor 18.8% |
| Immigrants | Sierra Leone | 10.8 /100 | #214 | Poor 18.7% |
| Eastern Europeans | 10.6 /100 | #215 | Poor 18.7% |
| Immigrants | Nigeria | 10.3 /100 | #216 | Poor 18.7% |
| Immigrants | Italy | 10.2 /100 | #217 | Poor 18.7% |
| Immigrants | Portugal | 8.9 /100 | #218 | Tragic 18.6% |
| Immigrants | Armenia | 8.6 /100 | #219 | Tragic 18.6% |
| Nigerians | 7.9 /100 | #220 | Tragic 18.6% |
| Immigrants | Poland | 7.5 /100 | #221 | Tragic 18.6% |
| Belizeans | 7.3 /100 | #222 | Tragic 18.6% |
| Immigrants | Czechoslovakia | 5.9 /100 | #223 | Tragic 18.5% |
| Immigrants | Argentina | 5.6 /100 | #224 | Tragic 18.5% |
| Immigrants | Lithuania | 5.6 /100 | #225 | Tragic 18.5% |
| Immigrants | Hungary | 5.5 /100 | #226 | Tragic 18.5% |