Immigrants from Eastern Asia vs West Indian 3 or more Vehicles in Household
COMPARE
Immigrants from Eastern Asia
West Indian
3 or more Vehicles in Household
3 or more Vehicles in Household Comparison
Immigrants from Eastern Asia
West Indians
18.8%
3 OR MORE VEHICLES IN HOUSEHOLD
14.1/ 100
METRIC RATING
206th/ 347
METRIC RANK
13.7%
3 OR MORE VEHICLES IN HOUSEHOLD
0.0/ 100
METRIC RATING
330th/ 347
METRIC RANK
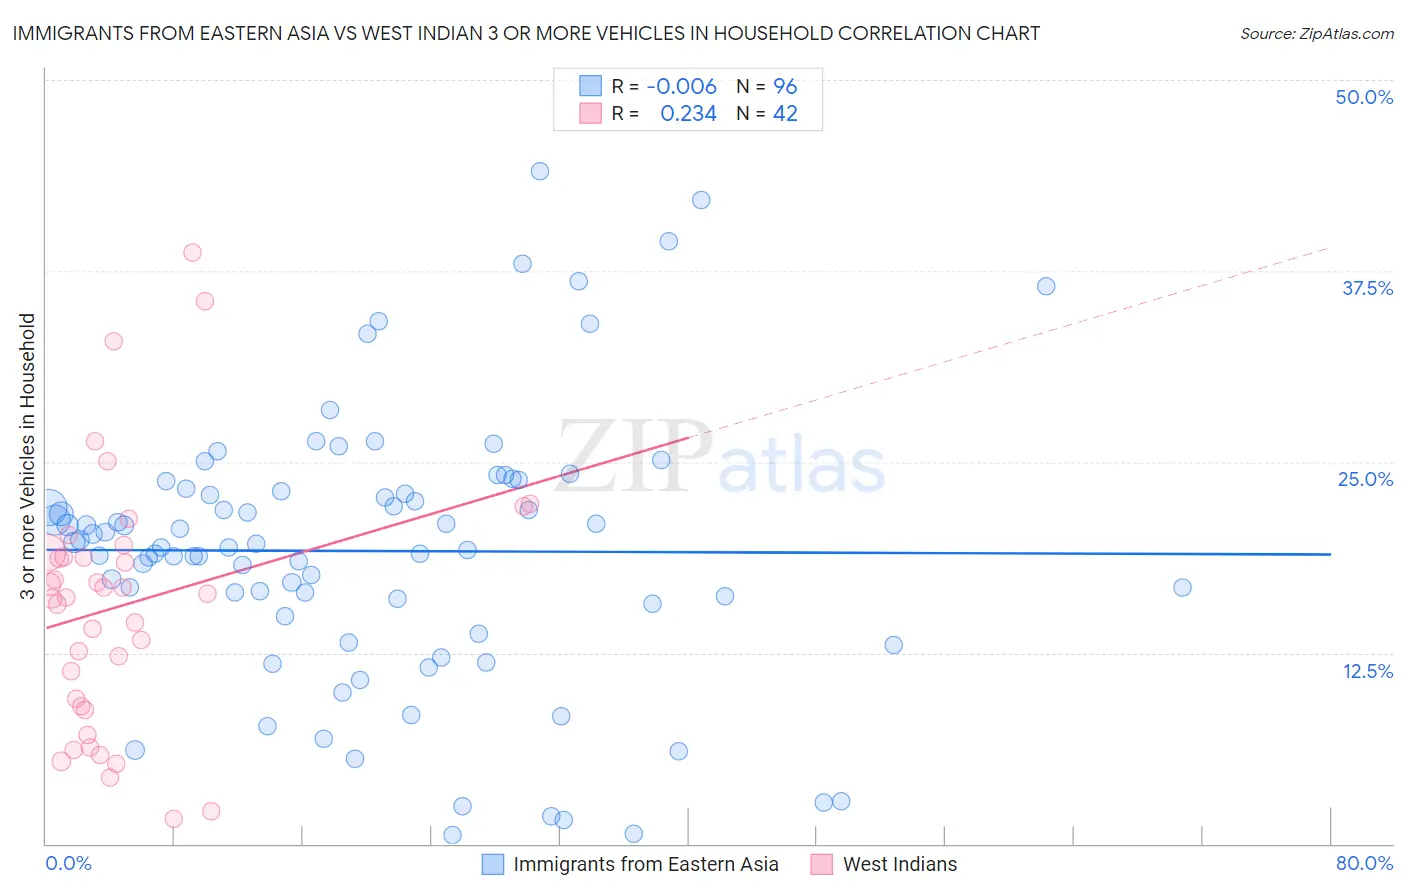
Immigrants from Eastern Asia vs West Indian 3 or more Vehicles in Household Correlation Chart
The statistical analysis conducted on geographies consisting of 499,168,797 people shows no correlation between the proportion of Immigrants from Eastern Asia and percentage of households with 3 or more vehicles available in the United States with a correlation coefficient (R) of -0.006 and weighted average of 18.8%. Similarly, the statistical analysis conducted on geographies consisting of 253,795,615 people shows a weak positive correlation between the proportion of West Indians and percentage of households with 3 or more vehicles available in the United States with a correlation coefficient (R) of 0.234 and weighted average of 13.7%, a difference of 37.0%.
3 or more Vehicles in Household Correlation Summary
| Measurement | Immigrants from Eastern Asia | West Indian |
| Minimum | 0.54% | 1.7% |
| Maximum | 44.0% | 38.7% |
| Range | 43.5% | 37.0% |
| Mean | 19.2% | 15.6% |
| Median | 19.5% | 16.3% |
| Interquartile 25% (IQ1) | 15.3% | 9.0% |
| Interquartile 75% (IQ3) | 23.2% | 19.1% |
| Interquartile Range (IQR) | 7.9% | 10.1% |
| Standard Deviation (Sample) | 8.9% | 8.4% |
| Standard Deviation (Population) | 8.9% | 8.3% |
Similar Demographics by 3 or more Vehicles in Household
Demographics Similar to Immigrants from Eastern Asia by 3 or more Vehicles in Household
In terms of 3 or more vehicles in household, the demographic groups most similar to Immigrants from Eastern Asia are Russian (18.8%, a difference of 0.010%), Immigrants from Romania (18.9%, a difference of 0.080%), Immigrants from Chile (18.8%, a difference of 0.080%), Immigrants from Burma/Myanmar (18.8%, a difference of 0.090%), and Immigrants from Egypt (18.8%, a difference of 0.10%).
| Demographics | Rating | Rank | 3 or more Vehicles in Household |
| Immigrants | Norway | 19.0 /100 | #199 | Poor 19.0% |
| Argentineans | 18.2 /100 | #200 | Poor 18.9% |
| Arabs | 17.7 /100 | #201 | Poor 18.9% |
| Immigrants | Austria | 15.4 /100 | #202 | Poor 18.9% |
| Tohono O'odham | 14.8 /100 | #203 | Poor 18.9% |
| Immigrants | Romania | 14.6 /100 | #204 | Poor 18.9% |
| Russians | 14.2 /100 | #205 | Poor 18.8% |
| Immigrants | Eastern Asia | 14.1 /100 | #206 | Poor 18.8% |
| Immigrants | Chile | 13.6 /100 | #207 | Poor 18.8% |
| Immigrants | Burma/Myanmar | 13.6 /100 | #208 | Poor 18.8% |
| Immigrants | Egypt | 13.5 /100 | #209 | Poor 18.8% |
| Bulgarians | 13.1 /100 | #210 | Poor 18.8% |
| Immigrants | Kenya | 12.4 /100 | #211 | Poor 18.8% |
| Panamanians | 11.6 /100 | #212 | Poor 18.8% |
| Immigrants | Cuba | 11.6 /100 | #213 | Poor 18.8% |
Demographics Similar to West Indians by 3 or more Vehicles in Household
In terms of 3 or more vehicles in household, the demographic groups most similar to West Indians are Immigrants from Dominica (13.7%, a difference of 0.21%), Immigrants from Senegal (13.8%, a difference of 0.33%), Trinidadian and Tobagonian (13.6%, a difference of 0.93%), Immigrants from Cabo Verde (13.6%, a difference of 1.3%), and Immigrants from Albania (14.0%, a difference of 1.5%).
| Demographics | Rating | Rank | 3 or more Vehicles in Household |
| Immigrants | Caribbean | 0.0 /100 | #323 | Tragic 14.6% |
| Immigrants | Yemen | 0.0 /100 | #324 | Tragic 14.2% |
| Senegalese | 0.0 /100 | #325 | Tragic 14.2% |
| Soviet Union | 0.0 /100 | #326 | Tragic 14.2% |
| Ecuadorians | 0.0 /100 | #327 | Tragic 14.1% |
| Immigrants | Albania | 0.0 /100 | #328 | Tragic 14.0% |
| Immigrants | Senegal | 0.0 /100 | #329 | Tragic 13.8% |
| West Indians | 0.0 /100 | #330 | Tragic 13.7% |
| Immigrants | Dominica | 0.0 /100 | #331 | Tragic 13.7% |
| Trinidadians and Tobagonians | 0.0 /100 | #332 | Tragic 13.6% |
| Immigrants | Cabo Verde | 0.0 /100 | #333 | Tragic 13.6% |
| Immigrants | Ecuador | 0.0 /100 | #334 | Tragic 13.4% |
| Immigrants | Trinidad and Tobago | 0.0 /100 | #335 | Tragic 13.3% |
| Barbadians | 0.0 /100 | #336 | Tragic 12.6% |
| Immigrants | Bangladesh | 0.0 /100 | #337 | Tragic 12.5% |