Immigrants from Uzbekistan vs Immigrants from Scotland 3 or more Vehicles in Household
COMPARE
Immigrants from Uzbekistan
Immigrants from Scotland
3 or more Vehicles in Household
3 or more Vehicles in Household Comparison
Immigrants from Uzbekistan
Immigrants from Scotland
12.0%
3 OR MORE VEHICLES IN HOUSEHOLD
0.0/ 100
METRIC RATING
339th/ 347
METRIC RANK
20.8%
3 OR MORE VEHICLES IN HOUSEHOLD
97.1/ 100
METRIC RATING
108th/ 347
METRIC RANK
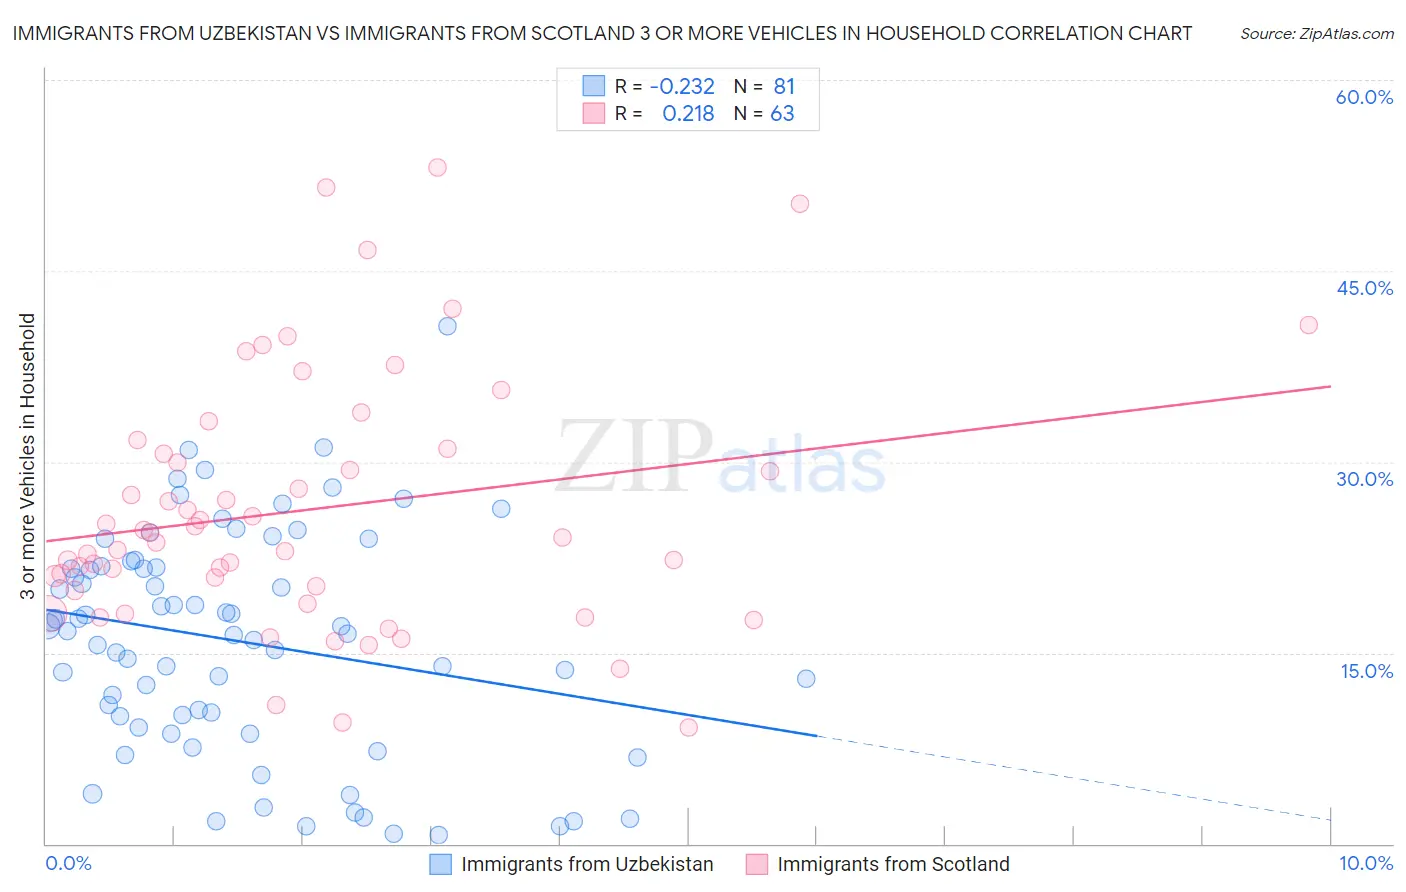
Immigrants from Uzbekistan vs Immigrants from Scotland 3 or more Vehicles in Household Correlation Chart
The statistical analysis conducted on geographies consisting of 118,708,326 people shows a weak negative correlation between the proportion of Immigrants from Uzbekistan and percentage of households with 3 or more vehicles available in the United States with a correlation coefficient (R) of -0.232 and weighted average of 12.0%. Similarly, the statistical analysis conducted on geographies consisting of 196,362,918 people shows a weak positive correlation between the proportion of Immigrants from Scotland and percentage of households with 3 or more vehicles available in the United States with a correlation coefficient (R) of 0.218 and weighted average of 20.8%, a difference of 73.5%.
3 or more Vehicles in Household Correlation Summary
| Measurement | Immigrants from Uzbekistan | Immigrants from Scotland |
| Minimum | 0.69% | 9.1% |
| Maximum | 40.7% | 53.1% |
| Range | 40.0% | 44.0% |
| Mean | 15.9% | 26.2% |
| Median | 16.7% | 24.0% |
| Interquartile 25% (IQ1) | 9.6% | 19.9% |
| Interquartile 75% (IQ3) | 21.8% | 31.0% |
| Interquartile Range (IQR) | 12.2% | 11.1% |
| Standard Deviation (Sample) | 8.7% | 9.9% |
| Standard Deviation (Population) | 8.7% | 9.8% |
Similar Demographics by 3 or more Vehicles in Household
Demographics Similar to Immigrants from Uzbekistan by 3 or more Vehicles in Household
In terms of 3 or more vehicles in household, the demographic groups most similar to Immigrants from Uzbekistan are Immigrants from Barbados (11.7%, a difference of 2.2%), Vietnamese (12.5%, a difference of 3.9%), Immigrants from Bangladesh (12.5%, a difference of 4.4%), Guyanese (11.5%, a difference of 4.7%), and British West Indian (11.4%, a difference of 4.7%).
| Demographics | Rating | Rank | 3 or more Vehicles in Household |
| Trinidadians and Tobagonians | 0.0 /100 | #332 | Tragic 13.6% |
| Immigrants | Cabo Verde | 0.0 /100 | #333 | Tragic 13.6% |
| Immigrants | Ecuador | 0.0 /100 | #334 | Tragic 13.4% |
| Immigrants | Trinidad and Tobago | 0.0 /100 | #335 | Tragic 13.3% |
| Barbadians | 0.0 /100 | #336 | Tragic 12.6% |
| Immigrants | Bangladesh | 0.0 /100 | #337 | Tragic 12.5% |
| Vietnamese | 0.0 /100 | #338 | Tragic 12.5% |
| Immigrants | Uzbekistan | 0.0 /100 | #339 | Tragic 12.0% |
| Immigrants | Barbados | 0.0 /100 | #340 | Tragic 11.7% |
| Guyanese | 0.0 /100 | #341 | Tragic 11.5% |
| British West Indians | 0.0 /100 | #342 | Tragic 11.4% |
| Immigrants | Guyana | 0.0 /100 | #343 | Tragic 11.2% |
| Dominicans | 0.0 /100 | #344 | Tragic 11.2% |
| Immigrants | Dominican Republic | 0.0 /100 | #345 | Tragic 10.4% |
| Immigrants | St. Vincent and the Grenadines | 0.0 /100 | #346 | Tragic 10.1% |
Demographics Similar to Immigrants from Scotland by 3 or more Vehicles in Household
In terms of 3 or more vehicles in household, the demographic groups most similar to Immigrants from Scotland are Filipino (20.8%, a difference of 0.060%), Immigrants from Germany (20.8%, a difference of 0.15%), Bolivian (20.8%, a difference of 0.19%), Asian (20.8%, a difference of 0.20%), and Immigrants from Micronesia (20.7%, a difference of 0.23%).
| Demographics | Rating | Rank | 3 or more Vehicles in Household |
| Blackfeet | 97.9 /100 | #101 | Exceptional 20.9% |
| Seminole | 97.8 /100 | #102 | Exceptional 20.9% |
| Dutch West Indians | 97.8 /100 | #103 | Exceptional 20.9% |
| Luxembourgers | 97.7 /100 | #104 | Exceptional 20.9% |
| Austrians | 97.5 /100 | #105 | Exceptional 20.9% |
| Bolivians | 97.4 /100 | #106 | Exceptional 20.8% |
| Immigrants | Germany | 97.4 /100 | #107 | Exceptional 20.8% |
| Immigrants | Scotland | 97.1 /100 | #108 | Exceptional 20.8% |
| Filipinos | 97.0 /100 | #109 | Exceptional 20.8% |
| Asians | 96.8 /100 | #110 | Exceptional 20.8% |
| Immigrants | Micronesia | 96.7 /100 | #111 | Exceptional 20.7% |
| Nicaraguans | 96.2 /100 | #112 | Exceptional 20.7% |
| Immigrants | England | 96.2 /100 | #113 | Exceptional 20.7% |
| Burmese | 95.8 /100 | #114 | Exceptional 20.6% |
| French Canadians | 95.0 /100 | #115 | Exceptional 20.6% |