Immigrants from Eastern Asia vs Moroccan 3 or more Vehicles in Household
COMPARE
Immigrants from Eastern Asia
Moroccan
3 or more Vehicles in Household
3 or more Vehicles in Household Comparison
Immigrants from Eastern Asia
Moroccans
18.8%
3 OR MORE VEHICLES IN HOUSEHOLD
14.1/ 100
METRIC RATING
206th/ 347
METRIC RANK
15.9%
3 OR MORE VEHICLES IN HOUSEHOLD
0.0/ 100
METRIC RATING
310th/ 347
METRIC RANK
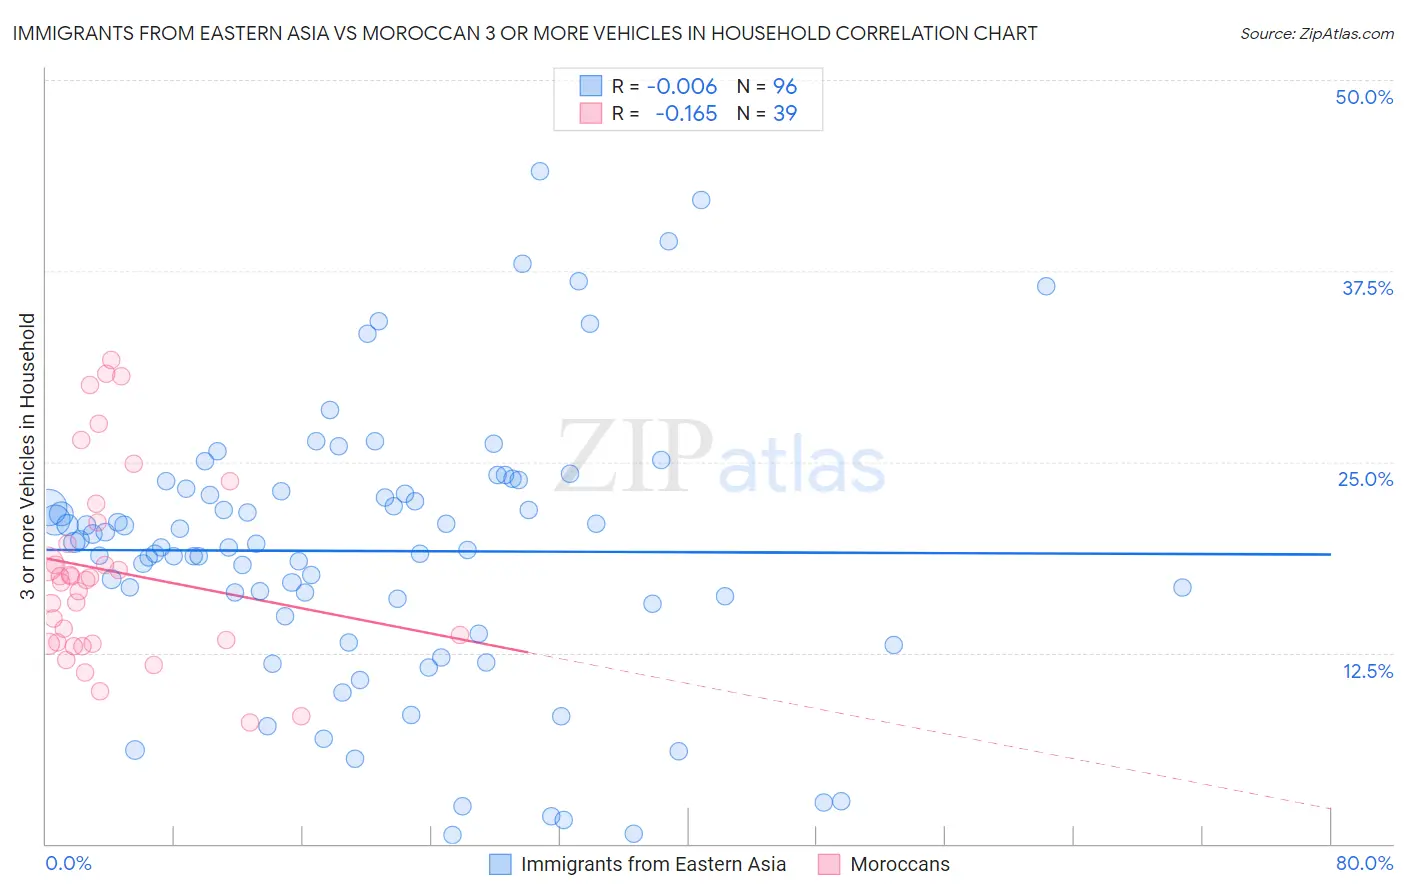
Immigrants from Eastern Asia vs Moroccan 3 or more Vehicles in Household Correlation Chart
The statistical analysis conducted on geographies consisting of 499,168,797 people shows no correlation between the proportion of Immigrants from Eastern Asia and percentage of households with 3 or more vehicles available in the United States with a correlation coefficient (R) of -0.006 and weighted average of 18.8%. Similarly, the statistical analysis conducted on geographies consisting of 201,717,590 people shows a poor negative correlation between the proportion of Moroccans and percentage of households with 3 or more vehicles available in the United States with a correlation coefficient (R) of -0.165 and weighted average of 15.9%, a difference of 18.6%.
3 or more Vehicles in Household Correlation Summary
| Measurement | Immigrants from Eastern Asia | Moroccan |
| Minimum | 0.54% | 7.9% |
| Maximum | 44.0% | 31.7% |
| Range | 43.5% | 23.7% |
| Mean | 19.2% | 17.9% |
| Median | 19.5% | 17.3% |
| Interquartile 25% (IQ1) | 15.3% | 13.1% |
| Interquartile 75% (IQ3) | 23.2% | 21.1% |
| Interquartile Range (IQR) | 7.9% | 8.0% |
| Standard Deviation (Sample) | 8.9% | 6.3% |
| Standard Deviation (Population) | 8.9% | 6.2% |
Similar Demographics by 3 or more Vehicles in Household
Demographics Similar to Immigrants from Eastern Asia by 3 or more Vehicles in Household
In terms of 3 or more vehicles in household, the demographic groups most similar to Immigrants from Eastern Asia are Russian (18.8%, a difference of 0.010%), Immigrants from Romania (18.9%, a difference of 0.080%), Immigrants from Chile (18.8%, a difference of 0.080%), Immigrants from Burma/Myanmar (18.8%, a difference of 0.090%), and Immigrants from Egypt (18.8%, a difference of 0.10%).
| Demographics | Rating | Rank | 3 or more Vehicles in Household |
| Immigrants | Norway | 19.0 /100 | #199 | Poor 19.0% |
| Argentineans | 18.2 /100 | #200 | Poor 18.9% |
| Arabs | 17.7 /100 | #201 | Poor 18.9% |
| Immigrants | Austria | 15.4 /100 | #202 | Poor 18.9% |
| Tohono O'odham | 14.8 /100 | #203 | Poor 18.9% |
| Immigrants | Romania | 14.6 /100 | #204 | Poor 18.9% |
| Russians | 14.2 /100 | #205 | Poor 18.8% |
| Immigrants | Eastern Asia | 14.1 /100 | #206 | Poor 18.8% |
| Immigrants | Chile | 13.6 /100 | #207 | Poor 18.8% |
| Immigrants | Burma/Myanmar | 13.6 /100 | #208 | Poor 18.8% |
| Immigrants | Egypt | 13.5 /100 | #209 | Poor 18.8% |
| Bulgarians | 13.1 /100 | #210 | Poor 18.8% |
| Immigrants | Kenya | 12.4 /100 | #211 | Poor 18.8% |
| Panamanians | 11.6 /100 | #212 | Poor 18.8% |
| Immigrants | Cuba | 11.6 /100 | #213 | Poor 18.8% |
Demographics Similar to Moroccans by 3 or more Vehicles in Household
In terms of 3 or more vehicles in household, the demographic groups most similar to Moroccans are Immigrants from Somalia (15.9%, a difference of 0.24%), Albanian (15.8%, a difference of 0.50%), Houma (16.1%, a difference of 1.2%), Puerto Rican (15.6%, a difference of 1.6%), and Immigrants from Israel (15.6%, a difference of 1.7%).
| Demographics | Rating | Rank | 3 or more Vehicles in Household |
| Immigrants | Serbia | 0.0 /100 | #303 | Tragic 16.4% |
| Ghanaians | 0.0 /100 | #304 | Tragic 16.4% |
| Immigrants | Morocco | 0.0 /100 | #305 | Tragic 16.3% |
| Somalis | 0.0 /100 | #306 | Tragic 16.2% |
| Immigrants | Ghana | 0.0 /100 | #307 | Tragic 16.2% |
| Houma | 0.0 /100 | #308 | Tragic 16.1% |
| Immigrants | Somalia | 0.0 /100 | #309 | Tragic 15.9% |
| Moroccans | 0.0 /100 | #310 | Tragic 15.9% |
| Albanians | 0.0 /100 | #311 | Tragic 15.8% |
| Puerto Ricans | 0.0 /100 | #312 | Tragic 15.6% |
| Immigrants | Israel | 0.0 /100 | #313 | Tragic 15.6% |
| Immigrants | Belarus | 0.0 /100 | #314 | Tragic 15.5% |
| Haitians | 0.0 /100 | #315 | Tragic 15.5% |
| U.S. Virgin Islanders | 0.0 /100 | #316 | Tragic 15.4% |
| Jamaicans | 0.0 /100 | #317 | Tragic 15.2% |