Scottish vs Immigrants from Scotland 3 or more Vehicles in Household
COMPARE
Scottish
Immigrants from Scotland
3 or more Vehicles in Household
3 or more Vehicles in Household Comparison
Scottish
Immigrants from Scotland
22.6%
3 OR MORE VEHICLES IN HOUSEHOLD
100.0/ 100
METRIC RATING
48th/ 347
METRIC RANK
20.8%
3 OR MORE VEHICLES IN HOUSEHOLD
97.1/ 100
METRIC RATING
108th/ 347
METRIC RANK
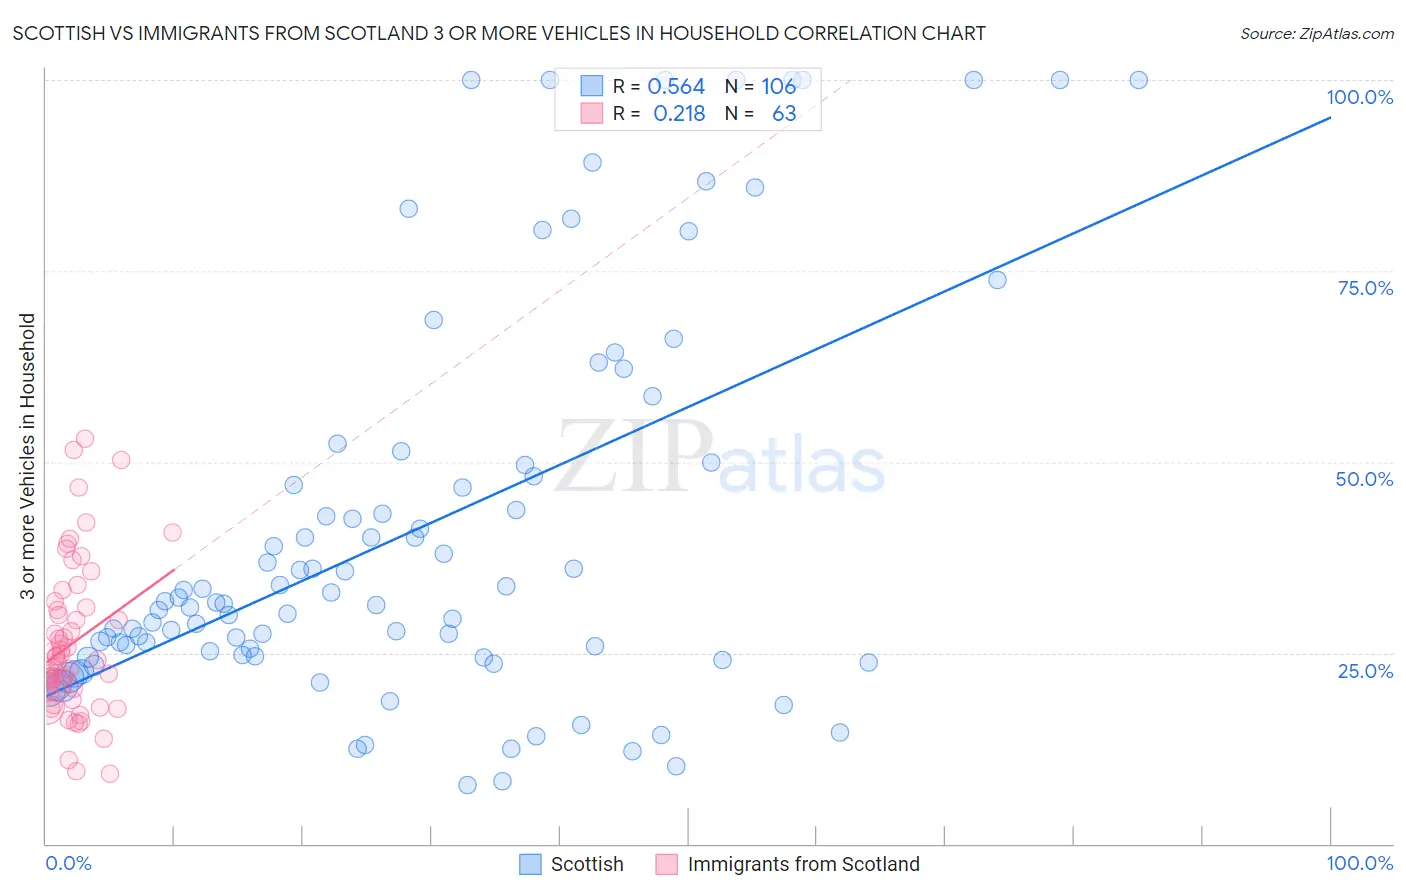
Scottish vs Immigrants from Scotland 3 or more Vehicles in Household Correlation Chart
The statistical analysis conducted on geographies consisting of 566,280,219 people shows a substantial positive correlation between the proportion of Scottish and percentage of households with 3 or more vehicles available in the United States with a correlation coefficient (R) of 0.564 and weighted average of 22.6%. Similarly, the statistical analysis conducted on geographies consisting of 196,362,918 people shows a weak positive correlation between the proportion of Immigrants from Scotland and percentage of households with 3 or more vehicles available in the United States with a correlation coefficient (R) of 0.218 and weighted average of 20.8%, a difference of 8.7%.
3 or more Vehicles in Household Correlation Summary
| Measurement | Scottish | Immigrants from Scotland |
| Minimum | 7.6% | 9.1% |
| Maximum | 100.0% | 53.1% |
| Range | 92.4% | 44.0% |
| Mean | 41.1% | 26.2% |
| Median | 31.5% | 24.0% |
| Interquartile 25% (IQ1) | 24.5% | 19.9% |
| Interquartile 75% (IQ3) | 49.6% | 31.0% |
| Interquartile Range (IQR) | 25.1% | 11.1% |
| Standard Deviation (Sample) | 25.7% | 9.9% |
| Standard Deviation (Population) | 25.6% | 9.8% |
Similar Demographics by 3 or more Vehicles in Household
Demographics Similar to Scottish by 3 or more Vehicles in Household
In terms of 3 or more vehicles in household, the demographic groups most similar to Scottish are Malaysian (22.6%, a difference of 0.010%), American (22.6%, a difference of 0.020%), Scotch-Irish (22.6%, a difference of 0.10%), Sioux (22.6%, a difference of 0.16%), and White/Caucasian (22.6%, a difference of 0.17%).
| Demographics | Rating | Rank | 3 or more Vehicles in Household |
| Germans | 100.0 /100 | #41 | Exceptional 22.7% |
| Natives/Alaskans | 100.0 /100 | #42 | Exceptional 22.7% |
| Osage | 100.0 /100 | #43 | Exceptional 22.7% |
| Cheyenne | 100.0 /100 | #44 | Exceptional 22.7% |
| Ute | 100.0 /100 | #45 | Exceptional 22.7% |
| Americans | 100.0 /100 | #46 | Exceptional 22.6% |
| Malaysians | 100.0 /100 | #47 | Exceptional 22.6% |
| Scottish | 100.0 /100 | #48 | Exceptional 22.6% |
| Scotch-Irish | 100.0 /100 | #49 | Exceptional 22.6% |
| Sioux | 100.0 /100 | #50 | Exceptional 22.6% |
| Whites/Caucasians | 100.0 /100 | #51 | Exceptional 22.6% |
| Welsh | 100.0 /100 | #52 | Exceptional 22.6% |
| Czechs | 100.0 /100 | #53 | Exceptional 22.5% |
| Crow | 100.0 /100 | #54 | Exceptional 22.5% |
| Immigrants | Laos | 100.0 /100 | #55 | Exceptional 22.4% |
Demographics Similar to Immigrants from Scotland by 3 or more Vehicles in Household
In terms of 3 or more vehicles in household, the demographic groups most similar to Immigrants from Scotland are Filipino (20.8%, a difference of 0.060%), Immigrants from Germany (20.8%, a difference of 0.15%), Bolivian (20.8%, a difference of 0.19%), Asian (20.8%, a difference of 0.20%), and Immigrants from Micronesia (20.7%, a difference of 0.23%).
| Demographics | Rating | Rank | 3 or more Vehicles in Household |
| Blackfeet | 97.9 /100 | #101 | Exceptional 20.9% |
| Seminole | 97.8 /100 | #102 | Exceptional 20.9% |
| Dutch West Indians | 97.8 /100 | #103 | Exceptional 20.9% |
| Luxembourgers | 97.7 /100 | #104 | Exceptional 20.9% |
| Austrians | 97.5 /100 | #105 | Exceptional 20.9% |
| Bolivians | 97.4 /100 | #106 | Exceptional 20.8% |
| Immigrants | Germany | 97.4 /100 | #107 | Exceptional 20.8% |
| Immigrants | Scotland | 97.1 /100 | #108 | Exceptional 20.8% |
| Filipinos | 97.0 /100 | #109 | Exceptional 20.8% |
| Asians | 96.8 /100 | #110 | Exceptional 20.8% |
| Immigrants | Micronesia | 96.7 /100 | #111 | Exceptional 20.7% |
| Nicaraguans | 96.2 /100 | #112 | Exceptional 20.7% |
| Immigrants | England | 96.2 /100 | #113 | Exceptional 20.7% |
| Burmese | 95.8 /100 | #114 | Exceptional 20.6% |
| French Canadians | 95.0 /100 | #115 | Exceptional 20.6% |