Immigrants from West Indies vs Immigrants from Scotland 3 or more Vehicles in Household
COMPARE
Immigrants from West Indies
Immigrants from Scotland
3 or more Vehicles in Household
3 or more Vehicles in Household Comparison
Immigrants from West Indies
Immigrants from Scotland
14.6%
3 OR MORE VEHICLES IN HOUSEHOLD
0.0/ 100
METRIC RATING
322nd/ 347
METRIC RANK
20.8%
3 OR MORE VEHICLES IN HOUSEHOLD
97.1/ 100
METRIC RATING
108th/ 347
METRIC RANK
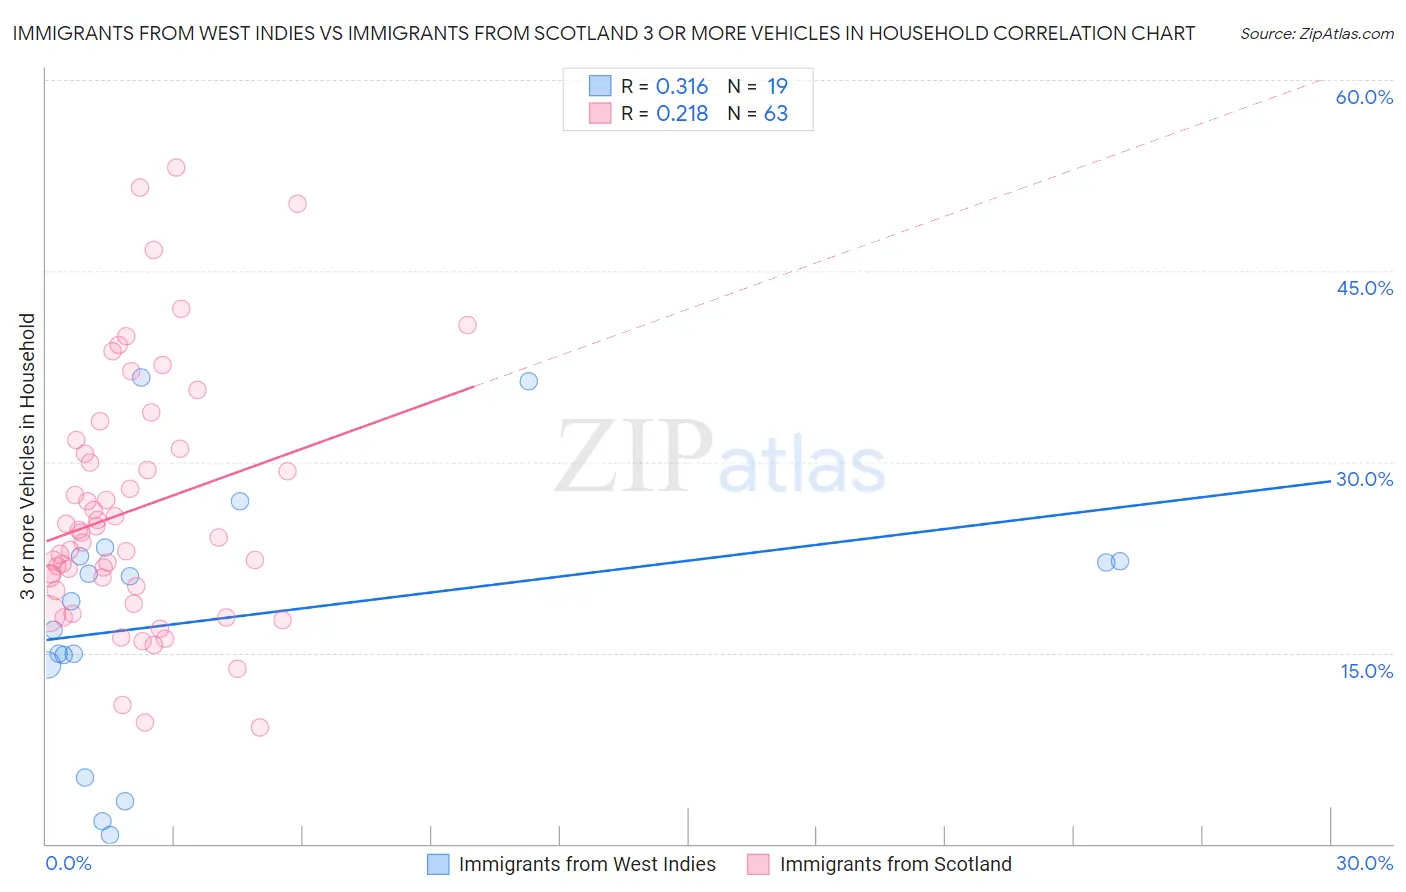
Immigrants from West Indies vs Immigrants from Scotland 3 or more Vehicles in Household Correlation Chart
The statistical analysis conducted on geographies consisting of 72,454,628 people shows a mild positive correlation between the proportion of Immigrants from West Indies and percentage of households with 3 or more vehicles available in the United States with a correlation coefficient (R) of 0.316 and weighted average of 14.6%. Similarly, the statistical analysis conducted on geographies consisting of 196,362,918 people shows a weak positive correlation between the proportion of Immigrants from Scotland and percentage of households with 3 or more vehicles available in the United States with a correlation coefficient (R) of 0.218 and weighted average of 20.8%, a difference of 42.2%.
3 or more Vehicles in Household Correlation Summary
| Measurement | Immigrants from West Indies | Immigrants from Scotland |
| Minimum | 0.69% | 9.1% |
| Maximum | 36.6% | 53.1% |
| Range | 35.9% | 44.0% |
| Mean | 17.8% | 26.2% |
| Median | 19.1% | 24.0% |
| Interquartile 25% (IQ1) | 14.0% | 19.9% |
| Interquartile 75% (IQ3) | 22.6% | 31.0% |
| Interquartile Range (IQR) | 8.5% | 11.1% |
| Standard Deviation (Sample) | 10.1% | 9.9% |
| Standard Deviation (Population) | 9.9% | 9.8% |
Similar Demographics by 3 or more Vehicles in Household
Demographics Similar to Immigrants from West Indies by 3 or more Vehicles in Household
In terms of 3 or more vehicles in household, the demographic groups most similar to Immigrants from West Indies are Immigrants from Jamaica (14.7%, a difference of 0.31%), Immigrants from Caribbean (14.6%, a difference of 0.44%), Yup'ik (14.8%, a difference of 1.4%), Cape Verdean (15.0%, a difference of 2.5%), and Immigrants from Yemen (14.2%, a difference of 2.8%).
| Demographics | Rating | Rank | 3 or more Vehicles in Household |
| Haitians | 0.0 /100 | #315 | Tragic 15.5% |
| U.S. Virgin Islanders | 0.0 /100 | #316 | Tragic 15.4% |
| Jamaicans | 0.0 /100 | #317 | Tragic 15.2% |
| Immigrants | Haiti | 0.0 /100 | #318 | Tragic 15.2% |
| Cape Verdeans | 0.0 /100 | #319 | Tragic 15.0% |
| Yup'ik | 0.0 /100 | #320 | Tragic 14.8% |
| Immigrants | Jamaica | 0.0 /100 | #321 | Tragic 14.7% |
| Immigrants | West Indies | 0.0 /100 | #322 | Tragic 14.6% |
| Immigrants | Caribbean | 0.0 /100 | #323 | Tragic 14.6% |
| Immigrants | Yemen | 0.0 /100 | #324 | Tragic 14.2% |
| Senegalese | 0.0 /100 | #325 | Tragic 14.2% |
| Soviet Union | 0.0 /100 | #326 | Tragic 14.2% |
| Ecuadorians | 0.0 /100 | #327 | Tragic 14.1% |
| Immigrants | Albania | 0.0 /100 | #328 | Tragic 14.0% |
| Immigrants | Senegal | 0.0 /100 | #329 | Tragic 13.8% |
Demographics Similar to Immigrants from Scotland by 3 or more Vehicles in Household
In terms of 3 or more vehicles in household, the demographic groups most similar to Immigrants from Scotland are Filipino (20.8%, a difference of 0.060%), Immigrants from Germany (20.8%, a difference of 0.15%), Bolivian (20.8%, a difference of 0.19%), Asian (20.8%, a difference of 0.20%), and Immigrants from Micronesia (20.7%, a difference of 0.23%).
| Demographics | Rating | Rank | 3 or more Vehicles in Household |
| Blackfeet | 97.9 /100 | #101 | Exceptional 20.9% |
| Seminole | 97.8 /100 | #102 | Exceptional 20.9% |
| Dutch West Indians | 97.8 /100 | #103 | Exceptional 20.9% |
| Luxembourgers | 97.7 /100 | #104 | Exceptional 20.9% |
| Austrians | 97.5 /100 | #105 | Exceptional 20.9% |
| Bolivians | 97.4 /100 | #106 | Exceptional 20.8% |
| Immigrants | Germany | 97.4 /100 | #107 | Exceptional 20.8% |
| Immigrants | Scotland | 97.1 /100 | #108 | Exceptional 20.8% |
| Filipinos | 97.0 /100 | #109 | Exceptional 20.8% |
| Asians | 96.8 /100 | #110 | Exceptional 20.8% |
| Immigrants | Micronesia | 96.7 /100 | #111 | Exceptional 20.7% |
| Nicaraguans | 96.2 /100 | #112 | Exceptional 20.7% |
| Immigrants | England | 96.2 /100 | #113 | Exceptional 20.7% |
| Burmese | 95.8 /100 | #114 | Exceptional 20.6% |
| French Canadians | 95.0 /100 | #115 | Exceptional 20.6% |