Immigrants from Eastern Asia vs Immigrants from Sweden 3 or more Vehicles in Household
COMPARE
Immigrants from Eastern Asia
Immigrants from Sweden
3 or more Vehicles in Household
3 or more Vehicles in Household Comparison
Immigrants from Eastern Asia
Immigrants from Sweden
18.8%
3 OR MORE VEHICLES IN HOUSEHOLD
14.1/ 100
METRIC RATING
206th/ 347
METRIC RANK
19.2%
3 OR MORE VEHICLES IN HOUSEHOLD
29.0/ 100
METRIC RATING
186th/ 347
METRIC RANK
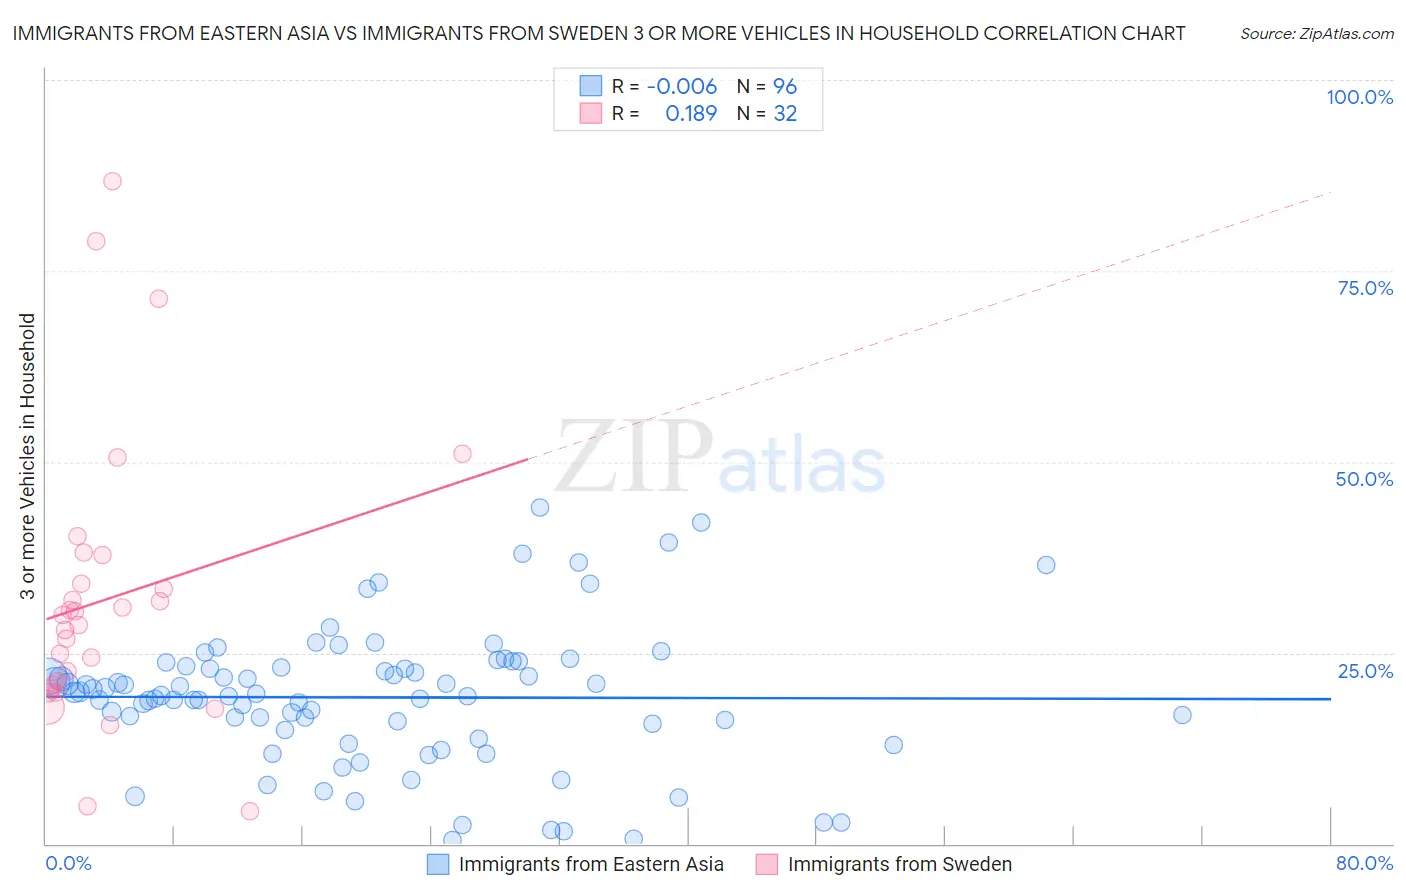
Immigrants from Eastern Asia vs Immigrants from Sweden 3 or more Vehicles in Household Correlation Chart
The statistical analysis conducted on geographies consisting of 499,168,797 people shows no correlation between the proportion of Immigrants from Eastern Asia and percentage of households with 3 or more vehicles available in the United States with a correlation coefficient (R) of -0.006 and weighted average of 18.8%. Similarly, the statistical analysis conducted on geographies consisting of 164,661,279 people shows a poor positive correlation between the proportion of Immigrants from Sweden and percentage of households with 3 or more vehicles available in the United States with a correlation coefficient (R) of 0.189 and weighted average of 19.2%, a difference of 1.8%.
3 or more Vehicles in Household Correlation Summary
| Measurement | Immigrants from Eastern Asia | Immigrants from Sweden |
| Minimum | 0.54% | 4.3% |
| Maximum | 44.0% | 86.7% |
| Range | 43.5% | 82.4% |
| Mean | 19.2% | 32.0% |
| Median | 19.5% | 29.2% |
| Interquartile 25% (IQ1) | 15.3% | 20.5% |
| Interquartile 75% (IQ3) | 23.2% | 35.9% |
| Interquartile Range (IQR) | 7.9% | 15.4% |
| Standard Deviation (Sample) | 8.9% | 18.6% |
| Standard Deviation (Population) | 8.9% | 18.3% |
Demographics Similar to Immigrants from Eastern Asia and Immigrants from Sweden by 3 or more Vehicles in Household
In terms of 3 or more vehicles in household, the demographic groups most similar to Immigrants from Eastern Asia are Russian (18.8%, a difference of 0.010%), Immigrants from Romania (18.9%, a difference of 0.080%), Tohono O'odham (18.9%, a difference of 0.11%), Immigrants from Austria (18.9%, a difference of 0.20%), and Arab (18.9%, a difference of 0.53%). Similarly, the demographic groups most similar to Immigrants from Sweden are Immigrants from Hong Kong (19.2%, a difference of 0.060%), Immigrants from Kuwait (19.1%, a difference of 0.28%), Indian (Asian) (19.1%, a difference of 0.29%), Immigrants from Zimbabwe (19.1%, a difference of 0.34%), and South American Indian (19.1%, a difference of 0.35%).
| Demographics | Rating | Rank | 3 or more Vehicles in Household |
| Immigrants | Sweden | 29.0 /100 | #186 | Fair 19.2% |
| Immigrants | Hong Kong | 28.3 /100 | #187 | Fair 19.2% |
| Immigrants | Kuwait | 26.1 /100 | #188 | Fair 19.1% |
| Indians (Asian) | 26.0 /100 | #189 | Fair 19.1% |
| Immigrants | Zimbabwe | 25.5 /100 | #190 | Fair 19.1% |
| South American Indians | 25.4 /100 | #191 | Fair 19.1% |
| Kenyans | 24.7 /100 | #192 | Fair 19.1% |
| Tsimshian | 24.4 /100 | #193 | Fair 19.1% |
| Serbians | 24.0 /100 | #194 | Fair 19.1% |
| Immigrants | Moldova | 23.6 /100 | #195 | Fair 19.1% |
| Central American Indians | 22.2 /100 | #196 | Fair 19.0% |
| Immigrants | Japan | 22.0 /100 | #197 | Fair 19.0% |
| Egyptians | 19.5 /100 | #198 | Poor 19.0% |
| Immigrants | Norway | 19.0 /100 | #199 | Poor 19.0% |
| Argentineans | 18.2 /100 | #200 | Poor 18.9% |
| Arabs | 17.7 /100 | #201 | Poor 18.9% |
| Immigrants | Austria | 15.4 /100 | #202 | Poor 18.9% |
| Tohono O'odham | 14.8 /100 | #203 | Poor 18.9% |
| Immigrants | Romania | 14.6 /100 | #204 | Poor 18.9% |
| Russians | 14.2 /100 | #205 | Poor 18.8% |
| Immigrants | Eastern Asia | 14.1 /100 | #206 | Poor 18.8% |