Immigrants from Asia vs Immigrants from Burma/Myanmar 3 or more Vehicles in Household
COMPARE
Immigrants from Asia
Immigrants from Burma/Myanmar
3 or more Vehicles in Household
3 or more Vehicles in Household Comparison
Immigrants from Asia
Immigrants from Burma/Myanmar
20.2%
3 OR MORE VEHICLES IN HOUSEHOLD
88.1/ 100
METRIC RATING
131st/ 347
METRIC RANK
18.8%
3 OR MORE VEHICLES IN HOUSEHOLD
13.6/ 100
METRIC RATING
208th/ 347
METRIC RANK
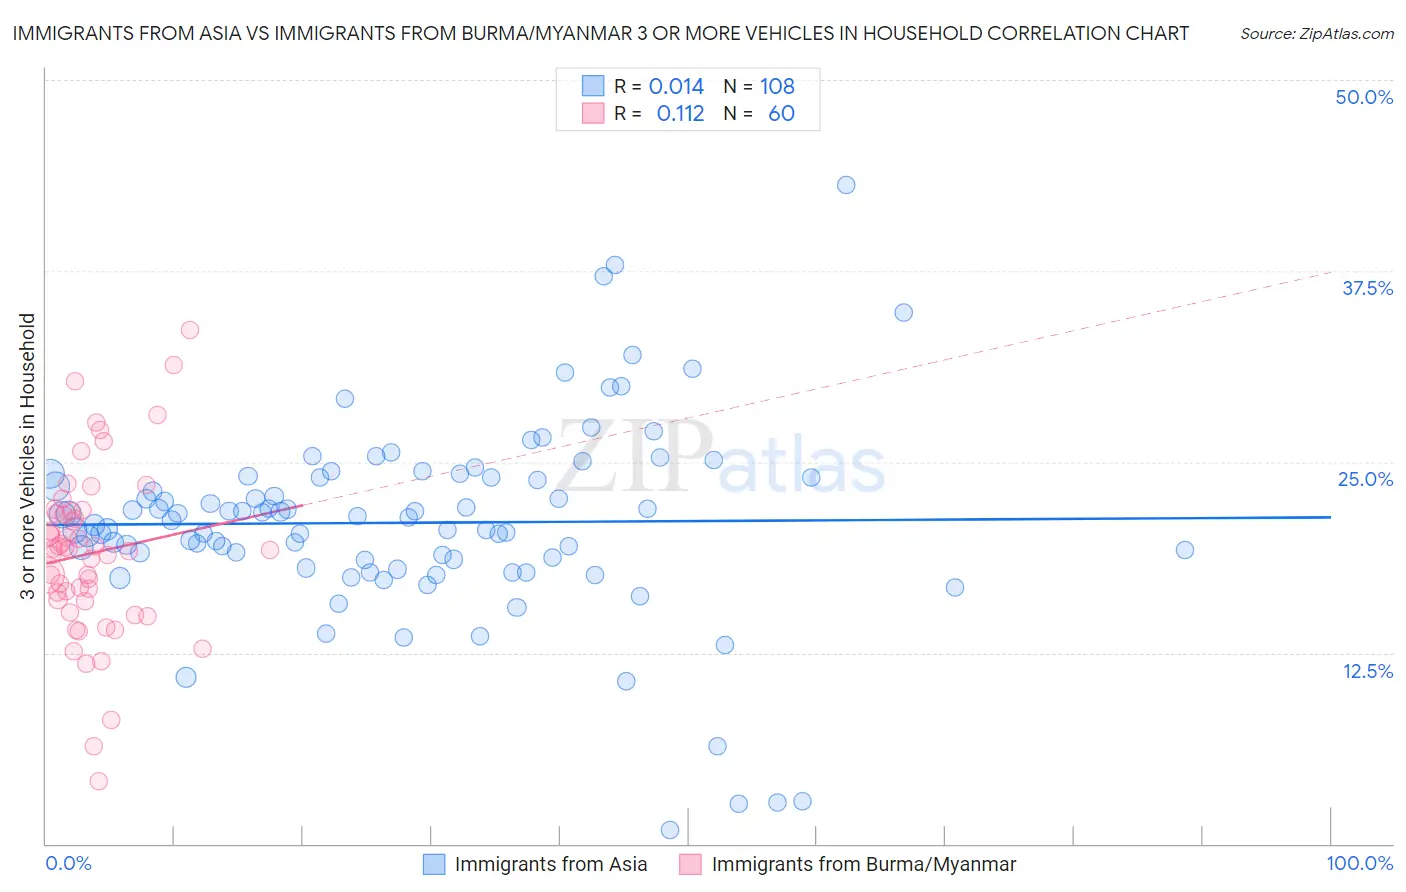
Immigrants from Asia vs Immigrants from Burma/Myanmar 3 or more Vehicles in Household Correlation Chart
The statistical analysis conducted on geographies consisting of 548,260,501 people shows no correlation between the proportion of Immigrants from Asia and percentage of households with 3 or more vehicles available in the United States with a correlation coefficient (R) of 0.014 and weighted average of 20.2%. Similarly, the statistical analysis conducted on geographies consisting of 172,233,426 people shows a poor positive correlation between the proportion of Immigrants from Burma/Myanmar and percentage of households with 3 or more vehicles available in the United States with a correlation coefficient (R) of 0.112 and weighted average of 18.8%, a difference of 7.5%.
3 or more Vehicles in Household Correlation Summary
| Measurement | Immigrants from Asia | Immigrants from Burma/Myanmar |
| Minimum | 0.88% | 4.1% |
| Maximum | 43.1% | 33.6% |
| Range | 42.3% | 29.5% |
| Mean | 21.0% | 19.0% |
| Median | 21.3% | 19.3% |
| Interquartile 25% (IQ1) | 18.6% | 15.9% |
| Interquartile 75% (IQ3) | 24.0% | 21.7% |
| Interquartile Range (IQR) | 5.4% | 5.8% |
| Standard Deviation (Sample) | 6.5% | 5.6% |
| Standard Deviation (Population) | 6.4% | 5.5% |
Similar Demographics by 3 or more Vehicles in Household
Demographics Similar to Immigrants from Asia by 3 or more Vehicles in Household
In terms of 3 or more vehicles in household, the demographic groups most similar to Immigrants from Asia are Immigrants from Canada (20.2%, a difference of 0.050%), Immigrants from North America (20.2%, a difference of 0.050%), Greek (20.3%, a difference of 0.070%), Zimbabwean (20.3%, a difference of 0.10%), and Polish (20.2%, a difference of 0.14%).
| Demographics | Rating | Rank | 3 or more Vehicles in Household |
| Central Americans | 93.1 /100 | #124 | Exceptional 20.5% |
| Immigrants | Netherlands | 92.9 /100 | #125 | Exceptional 20.4% |
| Slavs | 92.1 /100 | #126 | Exceptional 20.4% |
| Immigrants | Bolivia | 92.0 /100 | #127 | Exceptional 20.4% |
| New Zealanders | 91.3 /100 | #128 | Exceptional 20.4% |
| Zimbabweans | 88.7 /100 | #129 | Excellent 20.3% |
| Greeks | 88.6 /100 | #130 | Excellent 20.3% |
| Immigrants | Asia | 88.1 /100 | #131 | Excellent 20.2% |
| Immigrants | Canada | 87.8 /100 | #132 | Excellent 20.2% |
| Immigrants | North America | 87.8 /100 | #133 | Excellent 20.2% |
| Poles | 87.3 /100 | #134 | Excellent 20.2% |
| Immigrants | India | 87.2 /100 | #135 | Excellent 20.2% |
| Immigrants | Nicaragua | 87.1 /100 | #136 | Excellent 20.2% |
| Immigrants | Iraq | 87.1 /100 | #137 | Excellent 20.2% |
| Aleuts | 86.3 /100 | #138 | Excellent 20.2% |
Demographics Similar to Immigrants from Burma/Myanmar by 3 or more Vehicles in Household
In terms of 3 or more vehicles in household, the demographic groups most similar to Immigrants from Burma/Myanmar are Immigrants from Chile (18.8%, a difference of 0.010%), Immigrants from Egypt (18.8%, a difference of 0.010%), Immigrants from Eastern Asia (18.8%, a difference of 0.090%), Bulgarian (18.8%, a difference of 0.090%), and Russian (18.8%, a difference of 0.10%).
| Demographics | Rating | Rank | 3 or more Vehicles in Household |
| Arabs | 17.7 /100 | #201 | Poor 18.9% |
| Immigrants | Austria | 15.4 /100 | #202 | Poor 18.9% |
| Tohono O'odham | 14.8 /100 | #203 | Poor 18.9% |
| Immigrants | Romania | 14.6 /100 | #204 | Poor 18.9% |
| Russians | 14.2 /100 | #205 | Poor 18.8% |
| Immigrants | Eastern Asia | 14.1 /100 | #206 | Poor 18.8% |
| Immigrants | Chile | 13.6 /100 | #207 | Poor 18.8% |
| Immigrants | Burma/Myanmar | 13.6 /100 | #208 | Poor 18.8% |
| Immigrants | Egypt | 13.5 /100 | #209 | Poor 18.8% |
| Bulgarians | 13.1 /100 | #210 | Poor 18.8% |
| Immigrants | Kenya | 12.4 /100 | #211 | Poor 18.8% |
| Panamanians | 11.6 /100 | #212 | Poor 18.8% |
| Immigrants | Cuba | 11.6 /100 | #213 | Poor 18.8% |
| Immigrants | Sierra Leone | 10.8 /100 | #214 | Poor 18.7% |
| Eastern Europeans | 10.6 /100 | #215 | Poor 18.7% |