Immigrants from Asia vs Pakistani 3 or more Vehicles in Household
COMPARE
Immigrants from Asia
Pakistani
3 or more Vehicles in Household
3 or more Vehicles in Household Comparison
Immigrants from Asia
Pakistanis
20.2%
3 OR MORE VEHICLES IN HOUSEHOLD
88.1/ 100
METRIC RATING
131st/ 347
METRIC RANK
21.0%
3 OR MORE VEHICLES IN HOUSEHOLD
98.5/ 100
METRIC RATING
95th/ 347
METRIC RANK
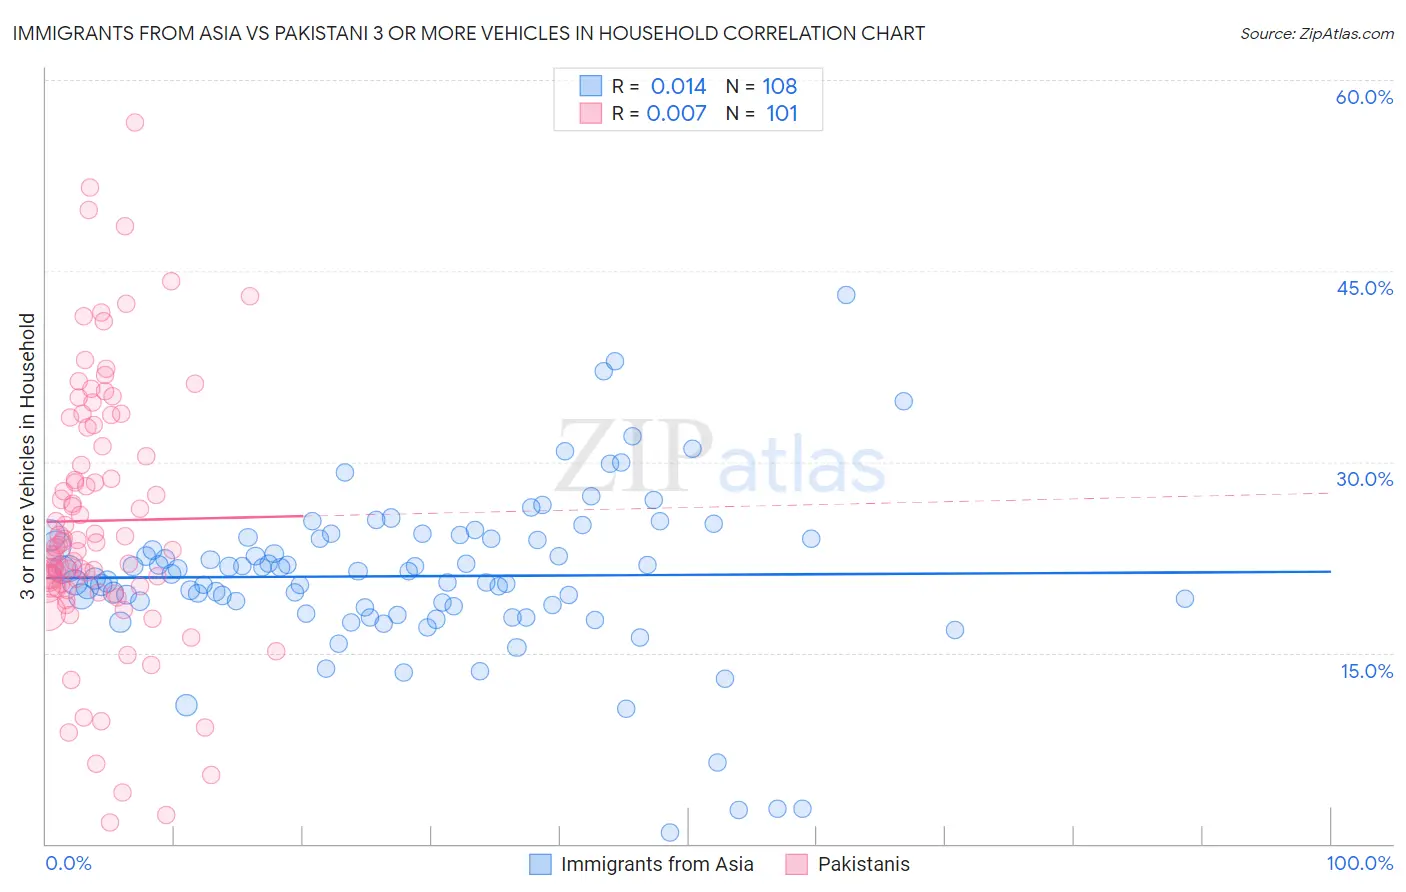
Immigrants from Asia vs Pakistani 3 or more Vehicles in Household Correlation Chart
The statistical analysis conducted on geographies consisting of 548,260,501 people shows no correlation between the proportion of Immigrants from Asia and percentage of households with 3 or more vehicles available in the United States with a correlation coefficient (R) of 0.014 and weighted average of 20.2%. Similarly, the statistical analysis conducted on geographies consisting of 335,121,243 people shows no correlation between the proportion of Pakistanis and percentage of households with 3 or more vehicles available in the United States with a correlation coefficient (R) of 0.007 and weighted average of 21.0%, a difference of 3.9%.
3 or more Vehicles in Household Correlation Summary
| Measurement | Immigrants from Asia | Pakistani |
| Minimum | 0.88% | 1.7% |
| Maximum | 43.1% | 56.7% |
| Range | 42.3% | 55.0% |
| Mean | 21.0% | 25.4% |
| Median | 21.3% | 23.5% |
| Interquartile 25% (IQ1) | 18.6% | 20.1% |
| Interquartile 75% (IQ3) | 24.0% | 32.8% |
| Interquartile Range (IQR) | 5.4% | 12.7% |
| Standard Deviation (Sample) | 6.5% | 10.5% |
| Standard Deviation (Population) | 6.4% | 10.4% |
Similar Demographics by 3 or more Vehicles in Household
Demographics Similar to Immigrants from Asia by 3 or more Vehicles in Household
In terms of 3 or more vehicles in household, the demographic groups most similar to Immigrants from Asia are Immigrants from Canada (20.2%, a difference of 0.050%), Immigrants from North America (20.2%, a difference of 0.050%), Greek (20.3%, a difference of 0.070%), Zimbabwean (20.3%, a difference of 0.10%), and Polish (20.2%, a difference of 0.14%).
| Demographics | Rating | Rank | 3 or more Vehicles in Household |
| Central Americans | 93.1 /100 | #124 | Exceptional 20.5% |
| Immigrants | Netherlands | 92.9 /100 | #125 | Exceptional 20.4% |
| Slavs | 92.1 /100 | #126 | Exceptional 20.4% |
| Immigrants | Bolivia | 92.0 /100 | #127 | Exceptional 20.4% |
| New Zealanders | 91.3 /100 | #128 | Exceptional 20.4% |
| Zimbabweans | 88.7 /100 | #129 | Excellent 20.3% |
| Greeks | 88.6 /100 | #130 | Excellent 20.3% |
| Immigrants | Asia | 88.1 /100 | #131 | Excellent 20.2% |
| Immigrants | Canada | 87.8 /100 | #132 | Excellent 20.2% |
| Immigrants | North America | 87.8 /100 | #133 | Excellent 20.2% |
| Poles | 87.3 /100 | #134 | Excellent 20.2% |
| Immigrants | India | 87.2 /100 | #135 | Excellent 20.2% |
| Immigrants | Nicaragua | 87.1 /100 | #136 | Excellent 20.2% |
| Immigrants | Iraq | 87.1 /100 | #137 | Excellent 20.2% |
| Aleuts | 86.3 /100 | #138 | Excellent 20.2% |
Demographics Similar to Pakistanis by 3 or more Vehicles in Household
In terms of 3 or more vehicles in household, the demographic groups most similar to Pakistanis are Cree (21.0%, a difference of 0.090%), Immigrants from Cambodia (21.1%, a difference of 0.14%), Canadian (21.0%, a difference of 0.20%), Hmong (21.0%, a difference of 0.26%), and Alaska Native (21.0%, a difference of 0.26%).
| Demographics | Rating | Rank | 3 or more Vehicles in Household |
| French | 99.4 /100 | #88 | Exceptional 21.4% |
| Marshallese | 99.2 /100 | #89 | Exceptional 21.3% |
| Immigrants | Afghanistan | 99.1 /100 | #90 | Exceptional 21.2% |
| Belgians | 98.9 /100 | #91 | Exceptional 21.2% |
| Apache | 98.9 /100 | #92 | Exceptional 21.2% |
| Immigrants | Indonesia | 98.8 /100 | #93 | Exceptional 21.1% |
| Immigrants | Cambodia | 98.6 /100 | #94 | Exceptional 21.1% |
| Pakistanis | 98.5 /100 | #95 | Exceptional 21.0% |
| Cree | 98.4 /100 | #96 | Exceptional 21.0% |
| Canadians | 98.3 /100 | #97 | Exceptional 21.0% |
| Hmong | 98.2 /100 | #98 | Exceptional 21.0% |
| Alaska Natives | 98.2 /100 | #99 | Exceptional 21.0% |
| Comanche | 98.2 /100 | #100 | Exceptional 21.0% |
| Blackfeet | 97.9 /100 | #101 | Exceptional 20.9% |
| Seminole | 97.8 /100 | #102 | Exceptional 20.9% |