Immigrants from Central America vs Immigrants from Burma/Myanmar 3 or more Vehicles in Household
COMPARE
Immigrants from Central America
Immigrants from Burma/Myanmar
3 or more Vehicles in Household
3 or more Vehicles in Household Comparison
Immigrants from Central America
Immigrants from Burma/Myanmar
23.4%
3 OR MORE VEHICLES IN HOUSEHOLD
100.0/ 100
METRIC RATING
25th/ 347
METRIC RANK
18.8%
3 OR MORE VEHICLES IN HOUSEHOLD
13.6/ 100
METRIC RATING
208th/ 347
METRIC RANK
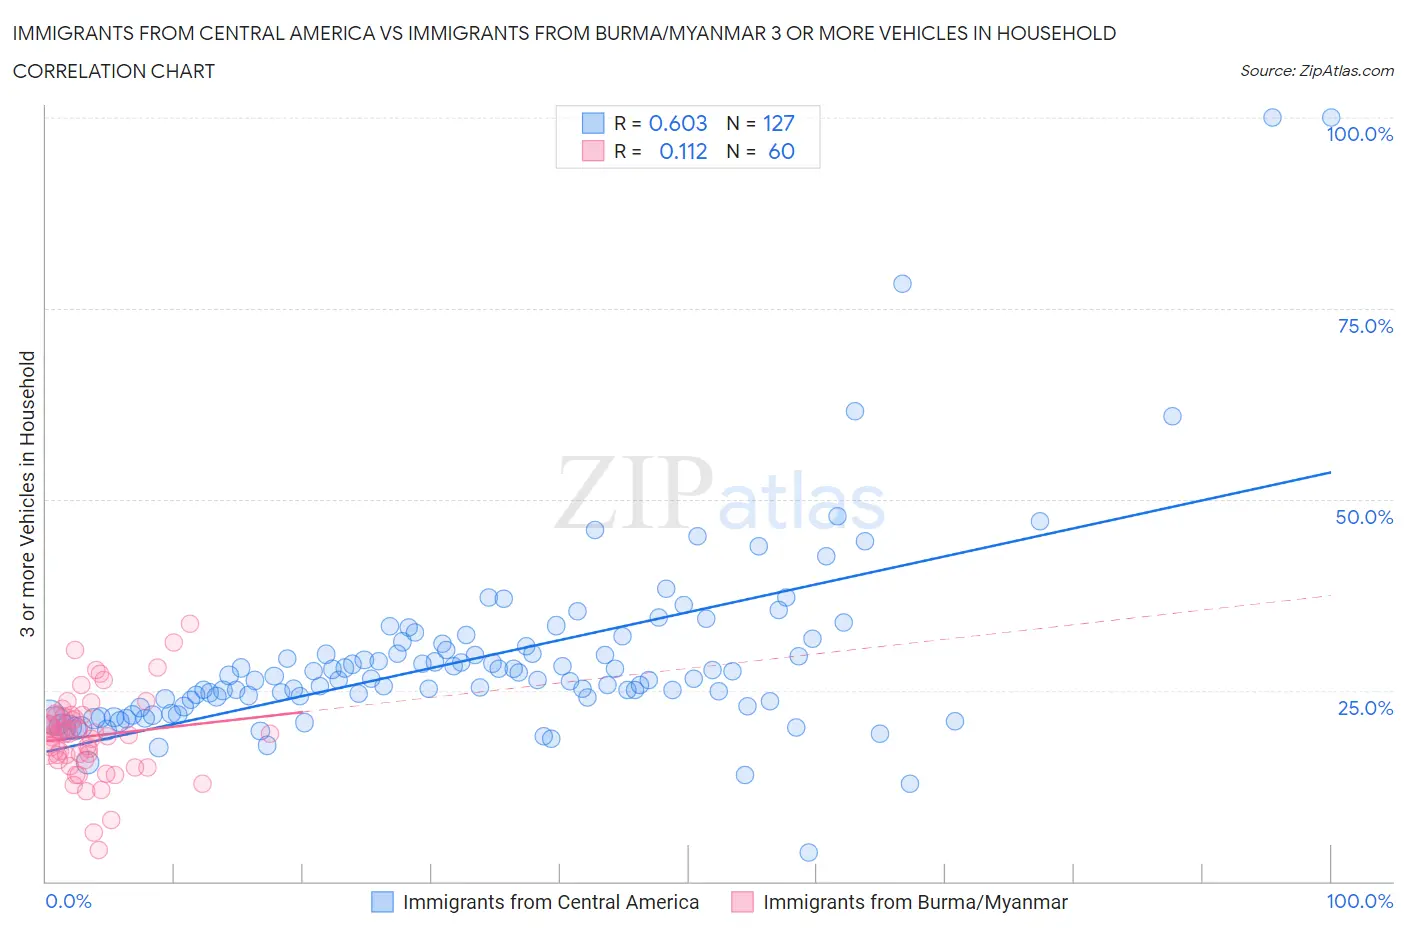
Immigrants from Central America vs Immigrants from Burma/Myanmar 3 or more Vehicles in Household Correlation Chart
The statistical analysis conducted on geographies consisting of 535,876,372 people shows a significant positive correlation between the proportion of Immigrants from Central America and percentage of households with 3 or more vehicles available in the United States with a correlation coefficient (R) of 0.603 and weighted average of 23.4%. Similarly, the statistical analysis conducted on geographies consisting of 172,233,426 people shows a poor positive correlation between the proportion of Immigrants from Burma/Myanmar and percentage of households with 3 or more vehicles available in the United States with a correlation coefficient (R) of 0.112 and weighted average of 18.8%, a difference of 24.5%.
3 or more Vehicles in Household Correlation Summary
| Measurement | Immigrants from Central America | Immigrants from Burma/Myanmar |
| Minimum | 3.8% | 4.1% |
| Maximum | 100.0% | 33.6% |
| Range | 96.2% | 29.5% |
| Mean | 29.1% | 19.0% |
| Median | 26.4% | 19.3% |
| Interquartile 25% (IQ1) | 22.9% | 15.9% |
| Interquartile 75% (IQ3) | 30.8% | 21.7% |
| Interquartile Range (IQR) | 7.9% | 5.8% |
| Standard Deviation (Sample) | 12.9% | 5.6% |
| Standard Deviation (Population) | 12.9% | 5.5% |
Similar Demographics by 3 or more Vehicles in Household
Demographics Similar to Immigrants from Central America by 3 or more Vehicles in Household
In terms of 3 or more vehicles in household, the demographic groups most similar to Immigrants from Central America are Sri Lankan (23.6%, a difference of 0.51%), Scandinavian (23.6%, a difference of 0.77%), Mexican American Indian (23.3%, a difference of 0.77%), Guamanian/Chamorro (23.2%, a difference of 0.91%), and Lumbee (23.1%, a difference of 1.2%).
| Demographics | Rating | Rank | 3 or more Vehicles in Household |
| Norwegians | 100.0 /100 | #18 | Exceptional 23.9% |
| Chinese | 100.0 /100 | #19 | Exceptional 23.9% |
| Paiute | 100.0 /100 | #20 | Exceptional 23.8% |
| Immigrants | Vietnam | 100.0 /100 | #21 | Exceptional 23.8% |
| Immigrants | Philippines | 100.0 /100 | #22 | Exceptional 23.8% |
| Scandinavians | 100.0 /100 | #23 | Exceptional 23.6% |
| Sri Lankans | 100.0 /100 | #24 | Exceptional 23.6% |
| Immigrants | Central America | 100.0 /100 | #25 | Exceptional 23.4% |
| Mexican American Indians | 100.0 /100 | #26 | Exceptional 23.3% |
| Guamanians/Chamorros | 100.0 /100 | #27 | Exceptional 23.2% |
| Lumbee | 100.0 /100 | #28 | Exceptional 23.1% |
| Spanish | 100.0 /100 | #29 | Exceptional 23.1% |
| Immigrants | South Eastern Asia | 100.0 /100 | #30 | Exceptional 23.1% |
| English | 100.0 /100 | #31 | Exceptional 23.1% |
| Pueblo | 100.0 /100 | #32 | Exceptional 23.0% |
Demographics Similar to Immigrants from Burma/Myanmar by 3 or more Vehicles in Household
In terms of 3 or more vehicles in household, the demographic groups most similar to Immigrants from Burma/Myanmar are Immigrants from Chile (18.8%, a difference of 0.010%), Immigrants from Egypt (18.8%, a difference of 0.010%), Immigrants from Eastern Asia (18.8%, a difference of 0.090%), Bulgarian (18.8%, a difference of 0.090%), and Russian (18.8%, a difference of 0.10%).
| Demographics | Rating | Rank | 3 or more Vehicles in Household |
| Arabs | 17.7 /100 | #201 | Poor 18.9% |
| Immigrants | Austria | 15.4 /100 | #202 | Poor 18.9% |
| Tohono O'odham | 14.8 /100 | #203 | Poor 18.9% |
| Immigrants | Romania | 14.6 /100 | #204 | Poor 18.9% |
| Russians | 14.2 /100 | #205 | Poor 18.8% |
| Immigrants | Eastern Asia | 14.1 /100 | #206 | Poor 18.8% |
| Immigrants | Chile | 13.6 /100 | #207 | Poor 18.8% |
| Immigrants | Burma/Myanmar | 13.6 /100 | #208 | Poor 18.8% |
| Immigrants | Egypt | 13.5 /100 | #209 | Poor 18.8% |
| Bulgarians | 13.1 /100 | #210 | Poor 18.8% |
| Immigrants | Kenya | 12.4 /100 | #211 | Poor 18.8% |
| Panamanians | 11.6 /100 | #212 | Poor 18.8% |
| Immigrants | Cuba | 11.6 /100 | #213 | Poor 18.8% |
| Immigrants | Sierra Leone | 10.8 /100 | #214 | Poor 18.7% |
| Eastern Europeans | 10.6 /100 | #215 | Poor 18.7% |