Immigrants from Asia vs Barbadian 3 or more Vehicles in Household
COMPARE
Immigrants from Asia
Barbadian
3 or more Vehicles in Household
3 or more Vehicles in Household Comparison
Immigrants from Asia
Barbadians
20.2%
3 OR MORE VEHICLES IN HOUSEHOLD
88.1/ 100
METRIC RATING
131st/ 347
METRIC RANK
12.6%
3 OR MORE VEHICLES IN HOUSEHOLD
0.0/ 100
METRIC RATING
336th/ 347
METRIC RANK
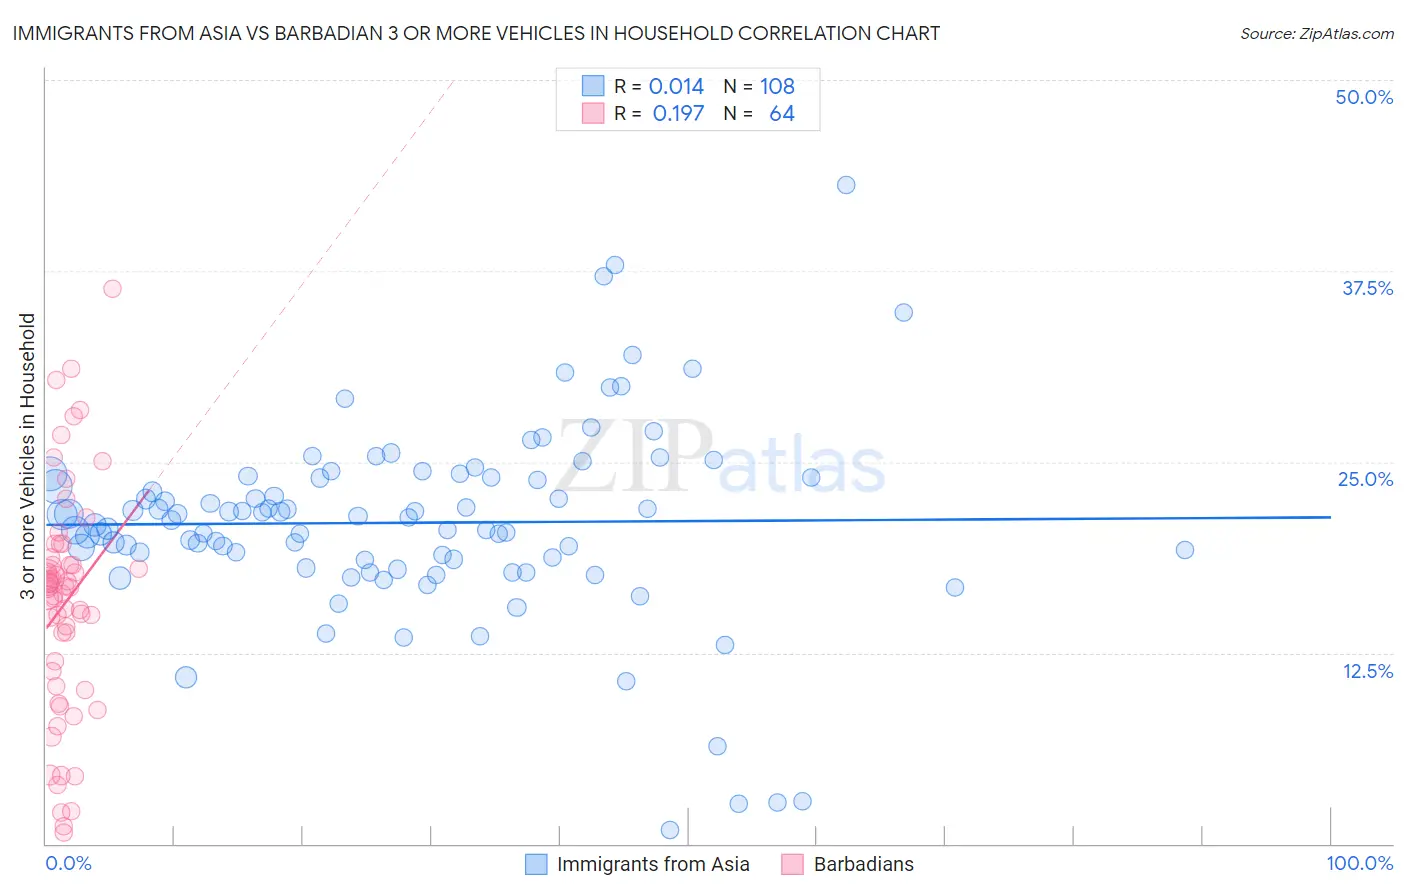
Immigrants from Asia vs Barbadian 3 or more Vehicles in Household Correlation Chart
The statistical analysis conducted on geographies consisting of 548,260,501 people shows no correlation between the proportion of Immigrants from Asia and percentage of households with 3 or more vehicles available in the United States with a correlation coefficient (R) of 0.014 and weighted average of 20.2%. Similarly, the statistical analysis conducted on geographies consisting of 141,251,971 people shows a poor positive correlation between the proportion of Barbadians and percentage of households with 3 or more vehicles available in the United States with a correlation coefficient (R) of 0.197 and weighted average of 12.6%, a difference of 61.0%.
3 or more Vehicles in Household Correlation Summary
| Measurement | Immigrants from Asia | Barbadian |
| Minimum | 0.88% | 0.77% |
| Maximum | 43.1% | 36.4% |
| Range | 42.3% | 35.6% |
| Mean | 21.0% | 15.8% |
| Median | 21.3% | 16.8% |
| Interquartile 25% (IQ1) | 18.6% | 10.8% |
| Interquartile 75% (IQ3) | 24.0% | 18.5% |
| Interquartile Range (IQR) | 5.4% | 7.7% |
| Standard Deviation (Sample) | 6.5% | 7.5% |
| Standard Deviation (Population) | 6.4% | 7.4% |
Similar Demographics by 3 or more Vehicles in Household
Demographics Similar to Immigrants from Asia by 3 or more Vehicles in Household
In terms of 3 or more vehicles in household, the demographic groups most similar to Immigrants from Asia are Immigrants from Canada (20.2%, a difference of 0.050%), Immigrants from North America (20.2%, a difference of 0.050%), Greek (20.3%, a difference of 0.070%), Zimbabwean (20.3%, a difference of 0.10%), and Polish (20.2%, a difference of 0.14%).
| Demographics | Rating | Rank | 3 or more Vehicles in Household |
| Central Americans | 93.1 /100 | #124 | Exceptional 20.5% |
| Immigrants | Netherlands | 92.9 /100 | #125 | Exceptional 20.4% |
| Slavs | 92.1 /100 | #126 | Exceptional 20.4% |
| Immigrants | Bolivia | 92.0 /100 | #127 | Exceptional 20.4% |
| New Zealanders | 91.3 /100 | #128 | Exceptional 20.4% |
| Zimbabweans | 88.7 /100 | #129 | Excellent 20.3% |
| Greeks | 88.6 /100 | #130 | Excellent 20.3% |
| Immigrants | Asia | 88.1 /100 | #131 | Excellent 20.2% |
| Immigrants | Canada | 87.8 /100 | #132 | Excellent 20.2% |
| Immigrants | North America | 87.8 /100 | #133 | Excellent 20.2% |
| Poles | 87.3 /100 | #134 | Excellent 20.2% |
| Immigrants | India | 87.2 /100 | #135 | Excellent 20.2% |
| Immigrants | Nicaragua | 87.1 /100 | #136 | Excellent 20.2% |
| Immigrants | Iraq | 87.1 /100 | #137 | Excellent 20.2% |
| Aleuts | 86.3 /100 | #138 | Excellent 20.2% |
Demographics Similar to Barbadians by 3 or more Vehicles in Household
In terms of 3 or more vehicles in household, the demographic groups most similar to Barbadians are Immigrants from Bangladesh (12.5%, a difference of 0.44%), Vietnamese (12.5%, a difference of 0.98%), Immigrants from Uzbekistan (12.0%, a difference of 4.9%), Immigrants from Trinidad and Tobago (13.3%, a difference of 6.1%), and Immigrants from Ecuador (13.4%, a difference of 6.6%).
| Demographics | Rating | Rank | 3 or more Vehicles in Household |
| Immigrants | Senegal | 0.0 /100 | #329 | Tragic 13.8% |
| West Indians | 0.0 /100 | #330 | Tragic 13.7% |
| Immigrants | Dominica | 0.0 /100 | #331 | Tragic 13.7% |
| Trinidadians and Tobagonians | 0.0 /100 | #332 | Tragic 13.6% |
| Immigrants | Cabo Verde | 0.0 /100 | #333 | Tragic 13.6% |
| Immigrants | Ecuador | 0.0 /100 | #334 | Tragic 13.4% |
| Immigrants | Trinidad and Tobago | 0.0 /100 | #335 | Tragic 13.3% |
| Barbadians | 0.0 /100 | #336 | Tragic 12.6% |
| Immigrants | Bangladesh | 0.0 /100 | #337 | Tragic 12.5% |
| Vietnamese | 0.0 /100 | #338 | Tragic 12.5% |
| Immigrants | Uzbekistan | 0.0 /100 | #339 | Tragic 12.0% |
| Immigrants | Barbados | 0.0 /100 | #340 | Tragic 11.7% |
| Guyanese | 0.0 /100 | #341 | Tragic 11.5% |
| British West Indians | 0.0 /100 | #342 | Tragic 11.4% |
| Immigrants | Guyana | 0.0 /100 | #343 | Tragic 11.2% |