Immigrants from Asia vs Immigrants from Burma/Myanmar 11th Grade
COMPARE
Immigrants from Asia
Immigrants from Burma/Myanmar
11th Grade
11th Grade Comparison
Immigrants from Asia
Immigrants from Burma/Myanmar
92.4%
11TH GRADE
37.4/ 100
METRIC RATING
184th/ 347
METRIC RANK
90.4%
11TH GRADE
0.0/ 100
METRIC RATING
285th/ 347
METRIC RANK
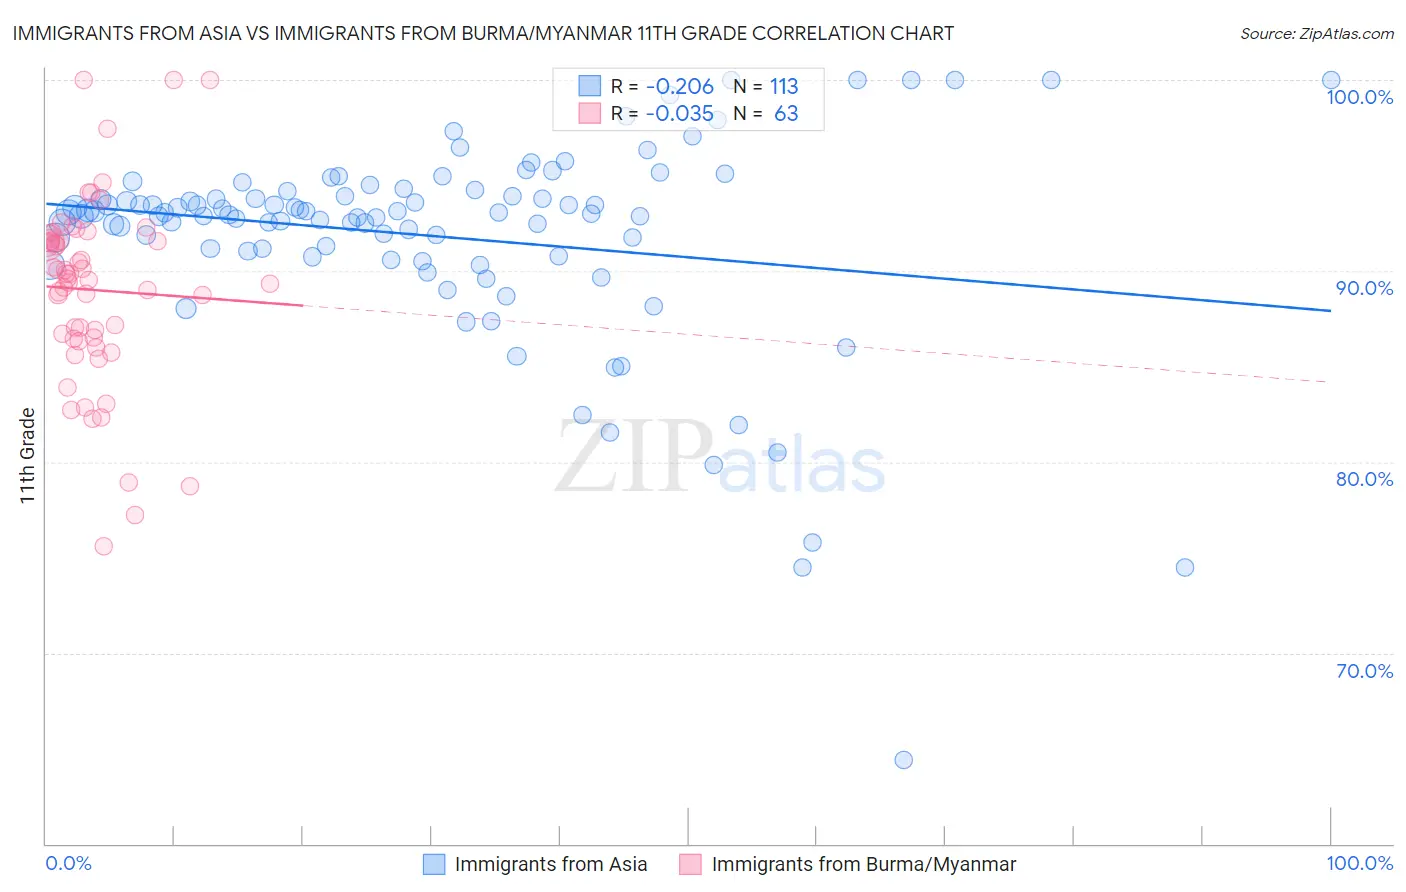
Immigrants from Asia vs Immigrants from Burma/Myanmar 11th Grade Correlation Chart
The statistical analysis conducted on geographies consisting of 549,170,438 people shows a weak negative correlation between the proportion of Immigrants from Asia and percentage of population with at least 11th grade education in the United States with a correlation coefficient (R) of -0.206 and weighted average of 92.4%. Similarly, the statistical analysis conducted on geographies consisting of 172,345,696 people shows no correlation between the proportion of Immigrants from Burma/Myanmar and percentage of population with at least 11th grade education in the United States with a correlation coefficient (R) of -0.035 and weighted average of 90.4%, a difference of 2.2%.
11th Grade Correlation Summary
| Measurement | Immigrants from Asia | Immigrants from Burma/Myanmar |
| Minimum | 64.4% | 75.6% |
| Maximum | 100.0% | 100.0% |
| Range | 35.6% | 24.4% |
| Mean | 91.8% | 89.0% |
| Median | 93.0% | 89.6% |
| Interquartile 25% (IQ1) | 90.9% | 86.4% |
| Interquartile 75% (IQ3) | 94.1% | 91.6% |
| Interquartile Range (IQR) | 3.1% | 5.1% |
| Standard Deviation (Sample) | 5.4% | 4.9% |
| Standard Deviation (Population) | 5.4% | 4.9% |
Similar Demographics by 11th Grade
Demographics Similar to Immigrants from Asia by 11th Grade
In terms of 11th grade, the demographic groups most similar to Immigrants from Asia are Immigrants from Malaysia (92.4%, a difference of 0.0%), Immigrants from Morocco (92.4%, a difference of 0.010%), Immigrants from Nepal (92.4%, a difference of 0.010%), Arapaho (92.4%, a difference of 0.020%), and Inupiat (92.4%, a difference of 0.030%).
| Demographics | Rating | Rank | 11th Grade |
| Guamanians/Chamorros | 45.0 /100 | #177 | Average 92.5% |
| Sudanese | 43.4 /100 | #178 | Average 92.5% |
| Creek | 40.9 /100 | #179 | Average 92.4% |
| Inupiat | 40.7 /100 | #180 | Average 92.4% |
| Cherokee | 40.7 /100 | #181 | Average 92.4% |
| Immigrants | Morocco | 38.6 /100 | #182 | Fair 92.4% |
| Immigrants | Malaysia | 37.6 /100 | #183 | Fair 92.4% |
| Immigrants | Asia | 37.4 /100 | #184 | Fair 92.4% |
| Immigrants | Nepal | 36.4 /100 | #185 | Fair 92.4% |
| Arapaho | 35.1 /100 | #186 | Fair 92.4% |
| Immigrants | Western Asia | 35.0 /100 | #187 | Fair 92.4% |
| Immigrants | Indonesia | 33.7 /100 | #188 | Fair 92.4% |
| Immigrants | Chile | 33.3 /100 | #189 | Fair 92.4% |
| Chickasaw | 31.4 /100 | #190 | Fair 92.3% |
| French American Indians | 30.8 /100 | #191 | Fair 92.3% |
Demographics Similar to Immigrants from Burma/Myanmar by 11th Grade
In terms of 11th grade, the demographic groups most similar to Immigrants from Burma/Myanmar are Immigrants from West Indies (90.4%, a difference of 0.050%), Apache (90.4%, a difference of 0.060%), Pennsylvania German (90.3%, a difference of 0.080%), Immigrants from Laos (90.5%, a difference of 0.090%), and British West Indian (90.3%, a difference of 0.11%).
| Demographics | Rating | Rank | 11th Grade |
| Malaysians | 0.1 /100 | #278 | Tragic 90.8% |
| Barbadians | 0.0 /100 | #279 | Tragic 90.8% |
| Sri Lankans | 0.0 /100 | #280 | Tragic 90.7% |
| Dutch West Indians | 0.0 /100 | #281 | Tragic 90.7% |
| Immigrants | St. Vincent and the Grenadines | 0.0 /100 | #282 | Tragic 90.7% |
| Immigrants | Barbados | 0.0 /100 | #283 | Tragic 90.7% |
| Immigrants | Laos | 0.0 /100 | #284 | Tragic 90.5% |
| Immigrants | Burma/Myanmar | 0.0 /100 | #285 | Tragic 90.4% |
| Immigrants | West Indies | 0.0 /100 | #286 | Tragic 90.4% |
| Apache | 0.0 /100 | #287 | Tragic 90.4% |
| Pennsylvania Germans | 0.0 /100 | #288 | Tragic 90.3% |
| British West Indians | 0.0 /100 | #289 | Tragic 90.3% |
| Indonesians | 0.0 /100 | #290 | Tragic 90.3% |
| Haitians | 0.0 /100 | #291 | Tragic 90.3% |
| Cubans | 0.0 /100 | #292 | Tragic 90.2% |