Immigrants from Asia vs Immigrants from Central America 3 or more Vehicles in Household
COMPARE
Immigrants from Asia
Immigrants from Central America
3 or more Vehicles in Household
3 or more Vehicles in Household Comparison
Immigrants from Asia
Immigrants from Central America
20.2%
3 OR MORE VEHICLES IN HOUSEHOLD
88.1/ 100
METRIC RATING
131st/ 347
METRIC RANK
23.4%
3 OR MORE VEHICLES IN HOUSEHOLD
100.0/ 100
METRIC RATING
25th/ 347
METRIC RANK
Immigrants from Asia vs Immigrants from Central America 3 or more Vehicles in Household Correlation Chart
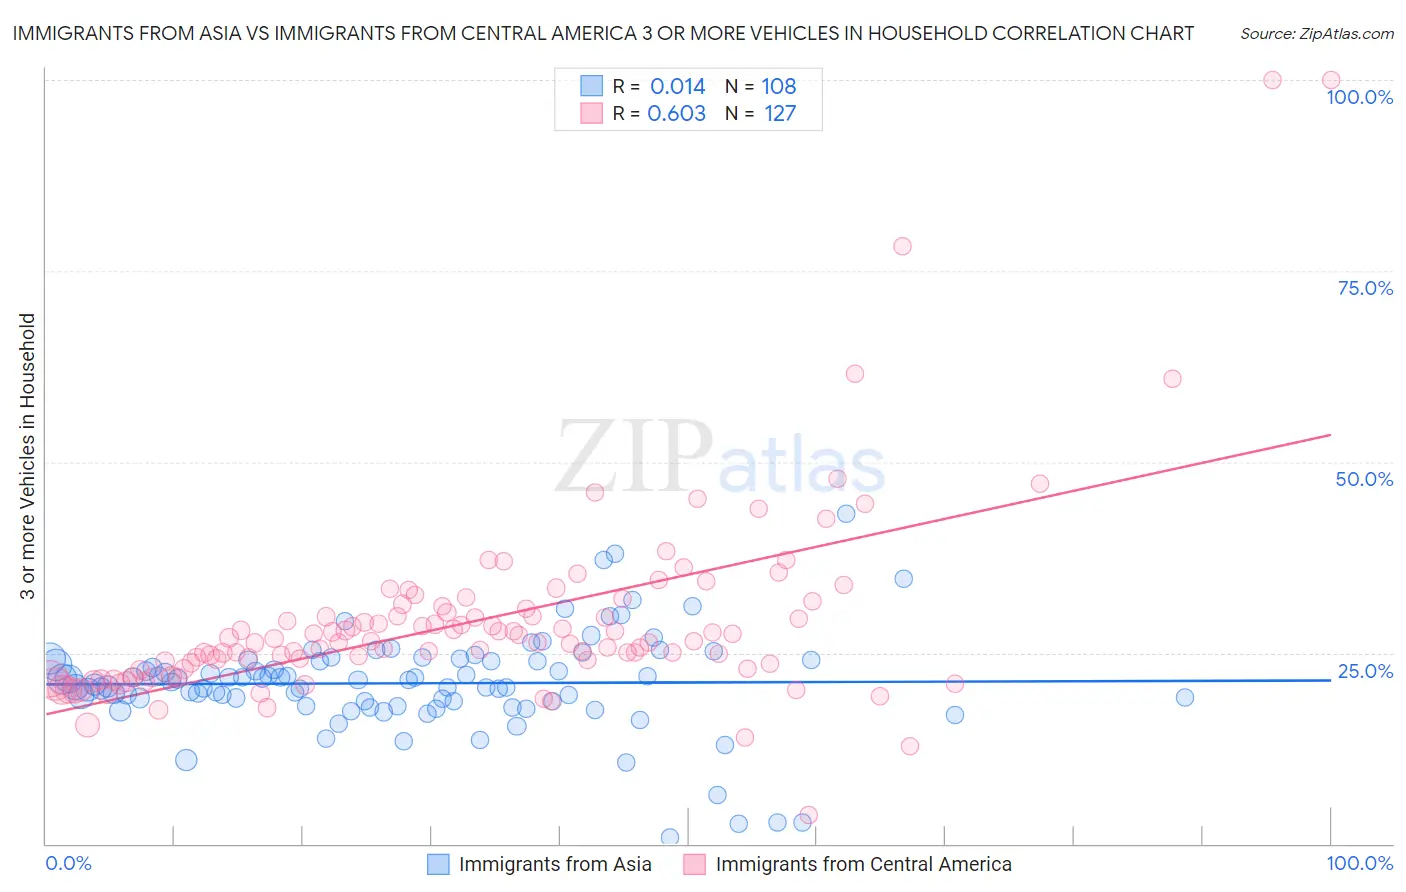
The statistical analysis conducted on geographies consisting of 548,260,501 people shows no correlation between the proportion of Immigrants from Asia and percentage of households with 3 or more vehicles available in the United States with a correlation coefficient (R) of 0.014 and weighted average of 20.2%. Similarly, the statistical analysis conducted on geographies consisting of 535,876,372 people shows a significant positive correlation between the proportion of Immigrants from Central America and percentage of households with 3 or more vehicles available in the United States with a correlation coefficient (R) of 0.603 and weighted average of 23.4%, a difference of 15.8%.
3 or more Vehicles in Household Correlation Summary
| Measurement | Immigrants from Asia | Immigrants from Central America |
| Minimum | 0.88% | 3.8% |
| Maximum | 43.1% | 100.0% |
| Range | 42.3% | 96.2% |
| Mean | 21.0% | 29.1% |
| Median | 21.3% | 26.4% |
| Interquartile 25% (IQ1) | 18.6% | 22.9% |
| Interquartile 75% (IQ3) | 24.0% | 30.8% |
| Interquartile Range (IQR) | 5.4% | 7.9% |
| Standard Deviation (Sample) | 6.5% | 12.9% |
| Standard Deviation (Population) | 6.4% | 12.9% |
Similar Demographics by 3 or more Vehicles in Household
Demographics Similar to Immigrants from Asia by 3 or more Vehicles in Household
In terms of 3 or more vehicles in household, the demographic groups most similar to Immigrants from Asia are Immigrants from Canada (20.2%, a difference of 0.050%), Immigrants from North America (20.2%, a difference of 0.050%), Greek (20.3%, a difference of 0.070%), Zimbabwean (20.3%, a difference of 0.10%), and Polish (20.2%, a difference of 0.14%).
| Demographics | Rating | Rank | 3 or more Vehicles in Household |
| Central Americans | 93.1 /100 | #124 | Exceptional 20.5% |
| Immigrants | Netherlands | 92.9 /100 | #125 | Exceptional 20.4% |
| Slavs | 92.1 /100 | #126 | Exceptional 20.4% |
| Immigrants | Bolivia | 92.0 /100 | #127 | Exceptional 20.4% |
| New Zealanders | 91.3 /100 | #128 | Exceptional 20.4% |
| Zimbabweans | 88.7 /100 | #129 | Excellent 20.3% |
| Greeks | 88.6 /100 | #130 | Excellent 20.3% |
| Immigrants | Asia | 88.1 /100 | #131 | Excellent 20.2% |
| Immigrants | Canada | 87.8 /100 | #132 | Excellent 20.2% |
| Immigrants | North America | 87.8 /100 | #133 | Excellent 20.2% |
| Poles | 87.3 /100 | #134 | Excellent 20.2% |
| Immigrants | India | 87.2 /100 | #135 | Excellent 20.2% |
| Immigrants | Nicaragua | 87.1 /100 | #136 | Excellent 20.2% |
| Immigrants | Iraq | 87.1 /100 | #137 | Excellent 20.2% |
| Aleuts | 86.3 /100 | #138 | Excellent 20.2% |
Demographics Similar to Immigrants from Central America by 3 or more Vehicles in Household
In terms of 3 or more vehicles in household, the demographic groups most similar to Immigrants from Central America are Sri Lankan (23.6%, a difference of 0.51%), Scandinavian (23.6%, a difference of 0.77%), Mexican American Indian (23.3%, a difference of 0.77%), Guamanian/Chamorro (23.2%, a difference of 0.91%), and Lumbee (23.1%, a difference of 1.2%).
| Demographics | Rating | Rank | 3 or more Vehicles in Household |
| Norwegians | 100.0 /100 | #18 | Exceptional 23.9% |
| Chinese | 100.0 /100 | #19 | Exceptional 23.9% |
| Paiute | 100.0 /100 | #20 | Exceptional 23.8% |
| Immigrants | Vietnam | 100.0 /100 | #21 | Exceptional 23.8% |
| Immigrants | Philippines | 100.0 /100 | #22 | Exceptional 23.8% |
| Scandinavians | 100.0 /100 | #23 | Exceptional 23.6% |
| Sri Lankans | 100.0 /100 | #24 | Exceptional 23.6% |
| Immigrants | Central America | 100.0 /100 | #25 | Exceptional 23.4% |
| Mexican American Indians | 100.0 /100 | #26 | Exceptional 23.3% |
| Guamanians/Chamorros | 100.0 /100 | #27 | Exceptional 23.2% |
| Lumbee | 100.0 /100 | #28 | Exceptional 23.1% |
| Spanish | 100.0 /100 | #29 | Exceptional 23.1% |
| Immigrants | South Eastern Asia | 100.0 /100 | #30 | Exceptional 23.1% |
| English | 100.0 /100 | #31 | Exceptional 23.1% |
| Pueblo | 100.0 /100 | #32 | Exceptional 23.0% |