Immigrants from Asia vs Immigrants from Bolivia 3 or more Vehicles in Household
COMPARE
Immigrants from Asia
Immigrants from Bolivia
3 or more Vehicles in Household
3 or more Vehicles in Household Comparison
Immigrants from Asia
Immigrants from Bolivia
20.2%
3 OR MORE VEHICLES IN HOUSEHOLD
88.1/ 100
METRIC RATING
131st/ 347
METRIC RANK
20.4%
3 OR MORE VEHICLES IN HOUSEHOLD
92.0/ 100
METRIC RATING
127th/ 347
METRIC RANK
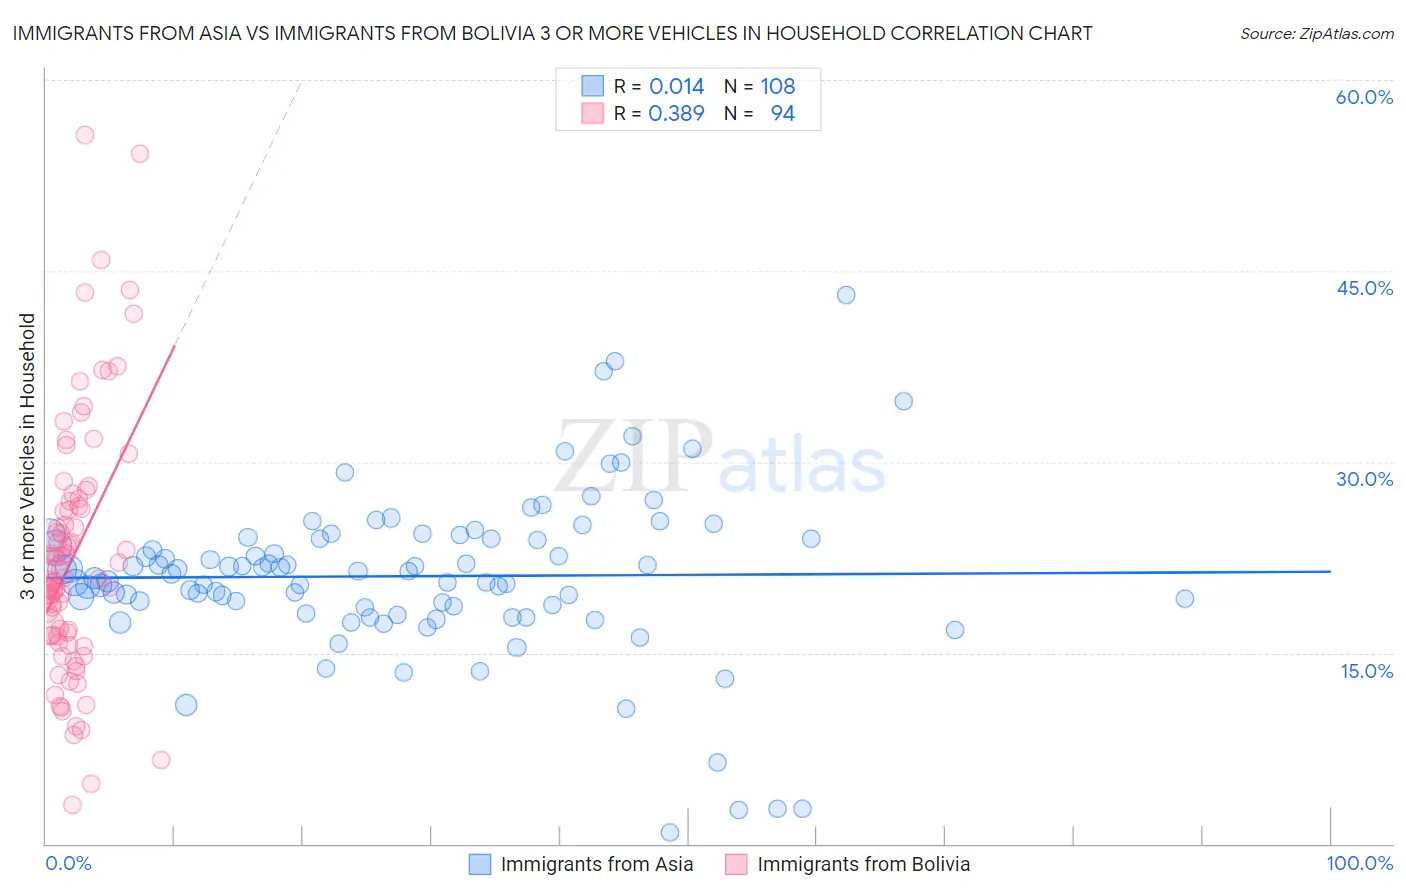
Immigrants from Asia vs Immigrants from Bolivia 3 or more Vehicles in Household Correlation Chart
The statistical analysis conducted on geographies consisting of 548,260,501 people shows no correlation between the proportion of Immigrants from Asia and percentage of households with 3 or more vehicles available in the United States with a correlation coefficient (R) of 0.014 and weighted average of 20.2%. Similarly, the statistical analysis conducted on geographies consisting of 158,700,588 people shows a mild positive correlation between the proportion of Immigrants from Bolivia and percentage of households with 3 or more vehicles available in the United States with a correlation coefficient (R) of 0.389 and weighted average of 20.4%, a difference of 0.79%.
3 or more Vehicles in Household Correlation Summary
| Measurement | Immigrants from Asia | Immigrants from Bolivia |
| Minimum | 0.88% | 3.1% |
| Maximum | 43.1% | 55.7% |
| Range | 42.3% | 52.6% |
| Mean | 21.0% | 22.5% |
| Median | 21.3% | 20.9% |
| Interquartile 25% (IQ1) | 18.6% | 16.3% |
| Interquartile 75% (IQ3) | 24.0% | 26.5% |
| Interquartile Range (IQR) | 5.4% | 10.2% |
| Standard Deviation (Sample) | 6.5% | 9.8% |
| Standard Deviation (Population) | 6.4% | 9.8% |
Demographics Similar to Immigrants from Asia and Immigrants from Bolivia by 3 or more Vehicles in Household
In terms of 3 or more vehicles in household, the demographic groups most similar to Immigrants from Asia are Immigrants from Canada (20.2%, a difference of 0.050%), Immigrants from North America (20.2%, a difference of 0.050%), Greek (20.3%, a difference of 0.070%), Zimbabwean (20.3%, a difference of 0.10%), and Polish (20.2%, a difference of 0.14%). Similarly, the demographic groups most similar to Immigrants from Bolivia are Slavic (20.4%, a difference of 0.030%), New Zealander (20.4%, a difference of 0.17%), Immigrants from Netherlands (20.4%, a difference of 0.25%), Central American (20.5%, a difference of 0.28%), and Immigrants from Korea (20.5%, a difference of 0.45%).
| Demographics | Rating | Rank | 3 or more Vehicles in Household |
| Immigrants | Latin America | 94.5 /100 | #119 | Exceptional 20.5% |
| Maltese | 93.9 /100 | #120 | Exceptional 20.5% |
| Immigrants | Thailand | 93.8 /100 | #121 | Exceptional 20.5% |
| German Russians | 93.7 /100 | #122 | Exceptional 20.5% |
| Immigrants | Korea | 93.7 /100 | #123 | Exceptional 20.5% |
| Central Americans | 93.1 /100 | #124 | Exceptional 20.5% |
| Immigrants | Netherlands | 92.9 /100 | #125 | Exceptional 20.4% |
| Slavs | 92.1 /100 | #126 | Exceptional 20.4% |
| Immigrants | Bolivia | 92.0 /100 | #127 | Exceptional 20.4% |
| New Zealanders | 91.3 /100 | #128 | Exceptional 20.4% |
| Zimbabweans | 88.7 /100 | #129 | Excellent 20.3% |
| Greeks | 88.6 /100 | #130 | Excellent 20.3% |
| Immigrants | Asia | 88.1 /100 | #131 | Excellent 20.2% |
| Immigrants | Canada | 87.8 /100 | #132 | Excellent 20.2% |
| Immigrants | North America | 87.8 /100 | #133 | Excellent 20.2% |
| Poles | 87.3 /100 | #134 | Excellent 20.2% |
| Immigrants | India | 87.2 /100 | #135 | Excellent 20.2% |
| Immigrants | Nicaragua | 87.1 /100 | #136 | Excellent 20.2% |
| Immigrants | Iraq | 87.1 /100 | #137 | Excellent 20.2% |
| Aleuts | 86.3 /100 | #138 | Excellent 20.2% |
| Slovenes | 85.5 /100 | #139 | Excellent 20.2% |