Immigrants from Asia vs Guyanese 3 or more Vehicles in Household
COMPARE
Immigrants from Asia
Guyanese
3 or more Vehicles in Household
3 or more Vehicles in Household Comparison
Immigrants from Asia
Guyanese
20.2%
3 OR MORE VEHICLES IN HOUSEHOLD
88.1/ 100
METRIC RATING
131st/ 347
METRIC RANK
11.5%
3 OR MORE VEHICLES IN HOUSEHOLD
0.0/ 100
METRIC RATING
341st/ 347
METRIC RANK
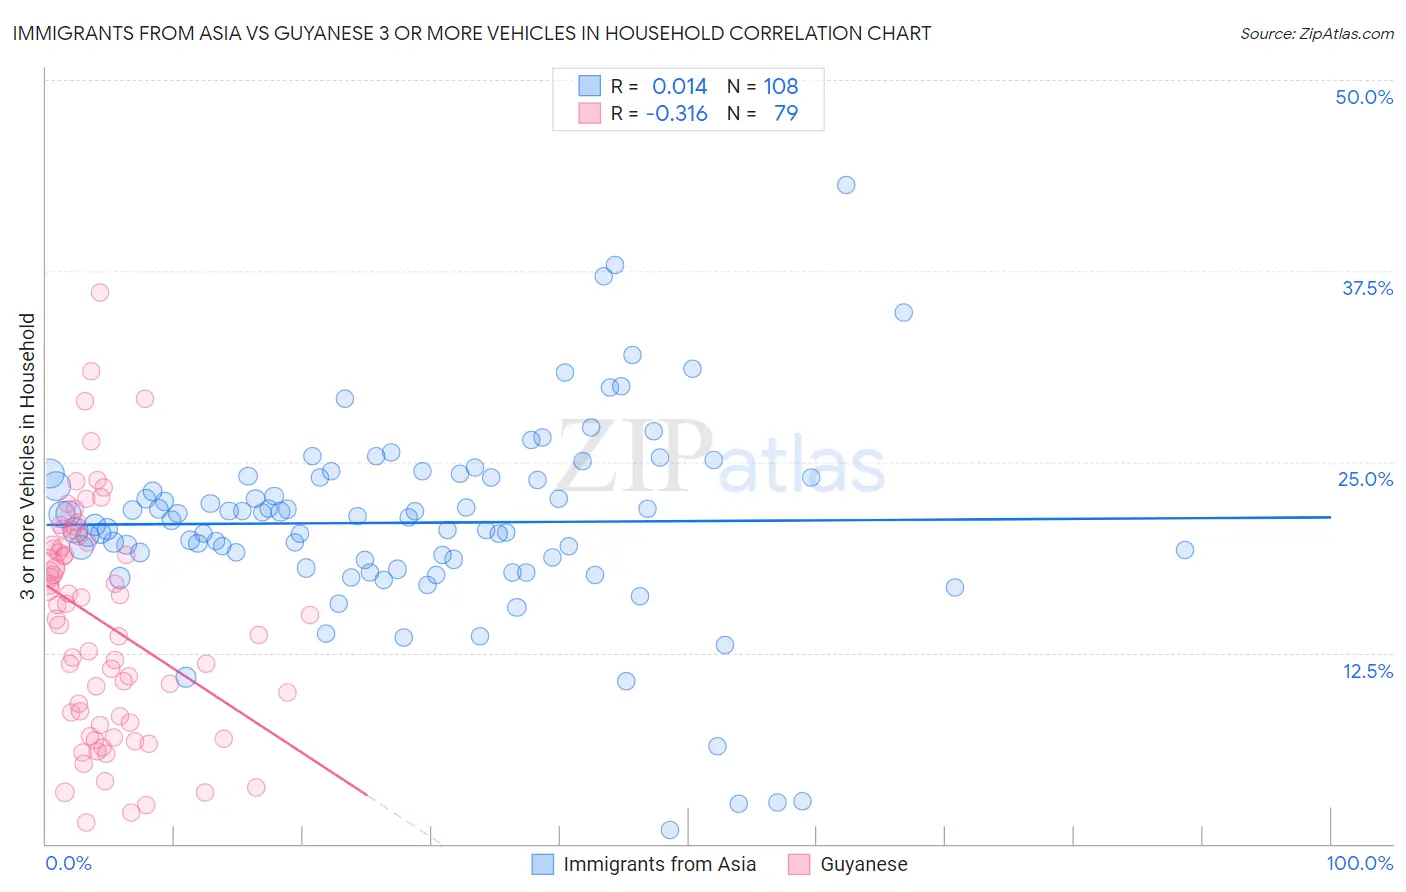
Immigrants from Asia vs Guyanese 3 or more Vehicles in Household Correlation Chart
The statistical analysis conducted on geographies consisting of 548,260,501 people shows no correlation between the proportion of Immigrants from Asia and percentage of households with 3 or more vehicles available in the United States with a correlation coefficient (R) of 0.014 and weighted average of 20.2%. Similarly, the statistical analysis conducted on geographies consisting of 176,755,882 people shows a mild negative correlation between the proportion of Guyanese and percentage of households with 3 or more vehicles available in the United States with a correlation coefficient (R) of -0.316 and weighted average of 11.5%, a difference of 76.7%.
3 or more Vehicles in Household Correlation Summary
| Measurement | Immigrants from Asia | Guyanese |
| Minimum | 0.88% | 1.4% |
| Maximum | 43.1% | 36.1% |
| Range | 42.3% | 34.7% |
| Mean | 21.0% | 14.5% |
| Median | 21.3% | 15.0% |
| Interquartile 25% (IQ1) | 18.6% | 7.9% |
| Interquartile 75% (IQ3) | 24.0% | 19.5% |
| Interquartile Range (IQR) | 5.4% | 11.6% |
| Standard Deviation (Sample) | 6.5% | 7.4% |
| Standard Deviation (Population) | 6.4% | 7.4% |
Similar Demographics by 3 or more Vehicles in Household
Demographics Similar to Immigrants from Asia by 3 or more Vehicles in Household
In terms of 3 or more vehicles in household, the demographic groups most similar to Immigrants from Asia are Immigrants from Canada (20.2%, a difference of 0.050%), Immigrants from North America (20.2%, a difference of 0.050%), Greek (20.3%, a difference of 0.070%), Zimbabwean (20.3%, a difference of 0.10%), and Polish (20.2%, a difference of 0.14%).
| Demographics | Rating | Rank | 3 or more Vehicles in Household |
| Central Americans | 93.1 /100 | #124 | Exceptional 20.5% |
| Immigrants | Netherlands | 92.9 /100 | #125 | Exceptional 20.4% |
| Slavs | 92.1 /100 | #126 | Exceptional 20.4% |
| Immigrants | Bolivia | 92.0 /100 | #127 | Exceptional 20.4% |
| New Zealanders | 91.3 /100 | #128 | Exceptional 20.4% |
| Zimbabweans | 88.7 /100 | #129 | Excellent 20.3% |
| Greeks | 88.6 /100 | #130 | Excellent 20.3% |
| Immigrants | Asia | 88.1 /100 | #131 | Excellent 20.2% |
| Immigrants | Canada | 87.8 /100 | #132 | Excellent 20.2% |
| Immigrants | North America | 87.8 /100 | #133 | Excellent 20.2% |
| Poles | 87.3 /100 | #134 | Excellent 20.2% |
| Immigrants | India | 87.2 /100 | #135 | Excellent 20.2% |
| Immigrants | Nicaragua | 87.1 /100 | #136 | Excellent 20.2% |
| Immigrants | Iraq | 87.1 /100 | #137 | Excellent 20.2% |
| Aleuts | 86.3 /100 | #138 | Excellent 20.2% |
Demographics Similar to Guyanese by 3 or more Vehicles in Household
In terms of 3 or more vehicles in household, the demographic groups most similar to Guyanese are British West Indian (11.4%, a difference of 0.040%), Immigrants from Guyana (11.2%, a difference of 1.9%), Dominican (11.2%, a difference of 2.0%), Immigrants from Barbados (11.7%, a difference of 2.4%), and Immigrants from Uzbekistan (12.0%, a difference of 4.7%).
| Demographics | Rating | Rank | 3 or more Vehicles in Household |
| Immigrants | Cabo Verde | 0.0 /100 | #333 | Tragic 13.6% |
| Immigrants | Ecuador | 0.0 /100 | #334 | Tragic 13.4% |
| Immigrants | Trinidad and Tobago | 0.0 /100 | #335 | Tragic 13.3% |
| Barbadians | 0.0 /100 | #336 | Tragic 12.6% |
| Immigrants | Bangladesh | 0.0 /100 | #337 | Tragic 12.5% |
| Vietnamese | 0.0 /100 | #338 | Tragic 12.5% |
| Immigrants | Uzbekistan | 0.0 /100 | #339 | Tragic 12.0% |
| Immigrants | Barbados | 0.0 /100 | #340 | Tragic 11.7% |
| Guyanese | 0.0 /100 | #341 | Tragic 11.5% |
| British West Indians | 0.0 /100 | #342 | Tragic 11.4% |
| Immigrants | Guyana | 0.0 /100 | #343 | Tragic 11.2% |
| Dominicans | 0.0 /100 | #344 | Tragic 11.2% |
| Immigrants | Dominican Republic | 0.0 /100 | #345 | Tragic 10.4% |
| Immigrants | St. Vincent and the Grenadines | 0.0 /100 | #346 | Tragic 10.1% |
| Immigrants | Grenada | 0.0 /100 | #347 | Tragic 9.1% |