Immigrants from Asia vs Immigrants from Burma/Myanmar 8th Grade
COMPARE
Immigrants from Asia
Immigrants from Burma/Myanmar
8th Grade
8th Grade Comparison
Immigrants from Asia
Immigrants from Burma/Myanmar
95.2%
8TH GRADE
3.1/ 100
METRIC RATING
233rd/ 347
METRIC RANK
94.1%
8TH GRADE
0.0/ 100
METRIC RATING
300th/ 347
METRIC RANK
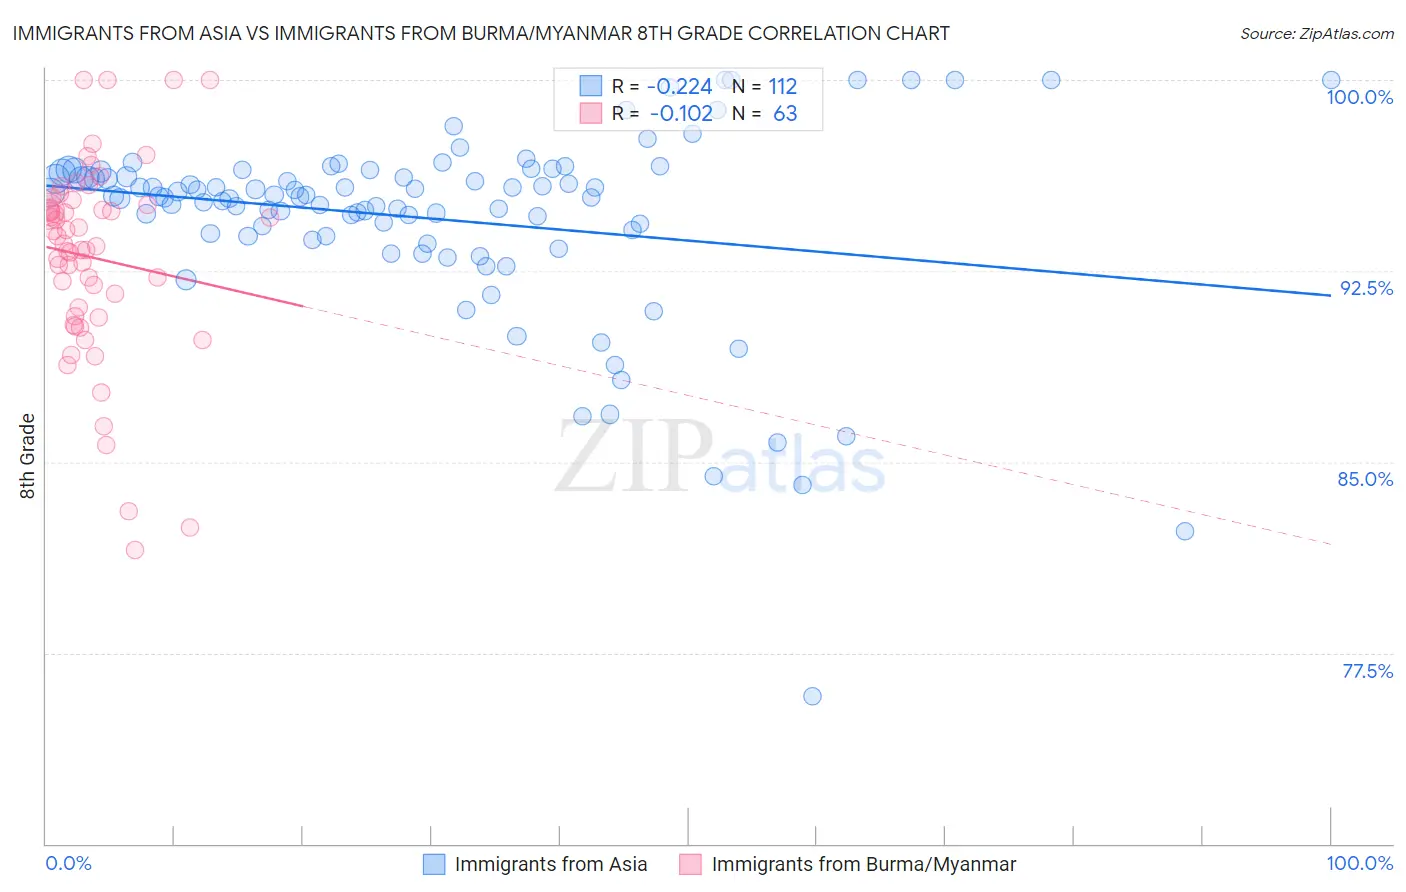
Immigrants from Asia vs Immigrants from Burma/Myanmar 8th Grade Correlation Chart
The statistical analysis conducted on geographies consisting of 549,167,442 people shows a weak negative correlation between the proportion of Immigrants from Asia and percentage of population with at least 8th grade education in the United States with a correlation coefficient (R) of -0.224 and weighted average of 95.2%. Similarly, the statistical analysis conducted on geographies consisting of 172,345,696 people shows a poor negative correlation between the proportion of Immigrants from Burma/Myanmar and percentage of population with at least 8th grade education in the United States with a correlation coefficient (R) of -0.102 and weighted average of 94.1%, a difference of 1.1%.
8th Grade Correlation Summary
| Measurement | Immigrants from Asia | Immigrants from Burma/Myanmar |
| Minimum | 75.8% | 81.5% |
| Maximum | 100.0% | 100.0% |
| Range | 24.2% | 18.5% |
| Mean | 94.6% | 93.0% |
| Median | 95.4% | 93.5% |
| Interquartile 25% (IQ1) | 93.9% | 90.7% |
| Interquartile 75% (IQ3) | 96.4% | 95.1% |
| Interquartile Range (IQR) | 2.5% | 4.4% |
| Standard Deviation (Sample) | 3.8% | 3.9% |
| Standard Deviation (Population) | 3.8% | 3.9% |
Similar Demographics by 8th Grade
Demographics Similar to Immigrants from Asia by 8th Grade
In terms of 8th grade, the demographic groups most similar to Immigrants from Asia are Costa Rican (95.2%, a difference of 0.0%), Indian (Asian) (95.2%, a difference of 0.010%), Nigerian (95.2%, a difference of 0.010%), Asian (95.2%, a difference of 0.020%), and Senegalese (95.2%, a difference of 0.020%).
| Demographics | Rating | Rank | 8th Grade |
| Navajo | 5.7 /100 | #226 | Tragic 95.3% |
| Bahamians | 5.6 /100 | #227 | Tragic 95.3% |
| Immigrants | Eastern Africa | 5.6 /100 | #228 | Tragic 95.3% |
| Immigrants | Indonesia | 4.4 /100 | #229 | Tragic 95.3% |
| Immigrants | Panama | 4.1 /100 | #230 | Tragic 95.2% |
| Asians | 3.5 /100 | #231 | Tragic 95.2% |
| Indians (Asian) | 3.3 /100 | #232 | Tragic 95.2% |
| Immigrants | Asia | 3.1 /100 | #233 | Tragic 95.2% |
| Costa Ricans | 3.0 /100 | #234 | Tragic 95.2% |
| Nigerians | 2.9 /100 | #235 | Tragic 95.2% |
| Senegalese | 2.7 /100 | #236 | Tragic 95.2% |
| Immigrants | Africa | 2.7 /100 | #237 | Tragic 95.2% |
| Natives/Alaskans | 2.3 /100 | #238 | Tragic 95.2% |
| Immigrants | Sierra Leone | 2.1 /100 | #239 | Tragic 95.1% |
| Ethiopians | 2.0 /100 | #240 | Tragic 95.1% |
Demographics Similar to Immigrants from Burma/Myanmar by 8th Grade
In terms of 8th grade, the demographic groups most similar to Immigrants from Burma/Myanmar are Cuban (94.1%, a difference of 0.010%), Immigrants from Laos (94.1%, a difference of 0.020%), Indonesian (94.1%, a difference of 0.030%), Immigrants from South Eastern Asia (94.2%, a difference of 0.070%), and Haitian (94.2%, a difference of 0.080%).
| Demographics | Rating | Rank | 8th Grade |
| Yaqui | 0.0 /100 | #293 | Tragic 94.2% |
| Houma | 0.0 /100 | #294 | Tragic 94.2% |
| Fijians | 0.0 /100 | #295 | Tragic 94.2% |
| Haitians | 0.0 /100 | #296 | Tragic 94.2% |
| Immigrants | South Eastern Asia | 0.0 /100 | #297 | Tragic 94.2% |
| Indonesians | 0.0 /100 | #298 | Tragic 94.1% |
| Cubans | 0.0 /100 | #299 | Tragic 94.1% |
| Immigrants | Burma/Myanmar | 0.0 /100 | #300 | Tragic 94.1% |
| Immigrants | Laos | 0.0 /100 | #301 | Tragic 94.1% |
| Sri Lankans | 0.0 /100 | #302 | Tragic 94.0% |
| Immigrants | Dominica | 0.0 /100 | #303 | Tragic 94.0% |
| Guyanese | 0.0 /100 | #304 | Tragic 93.9% |
| Immigrants | Haiti | 0.0 /100 | #305 | Tragic 93.9% |
| Immigrants | Guyana | 0.0 /100 | #306 | Tragic 93.8% |
| Immigrants | Portugal | 0.0 /100 | #307 | Tragic 93.8% |