French American Indian vs Immigrants from Chile 3 or more Vehicles in Household
COMPARE
French American Indian
Immigrants from Chile
3 or more Vehicles in Household
3 or more Vehicles in Household Comparison
French American Indians
Immigrants from Chile
20.1%
3 OR MORE VEHICLES IN HOUSEHOLD
85.3/ 100
METRIC RATING
140th/ 347
METRIC RANK
18.8%
3 OR MORE VEHICLES IN HOUSEHOLD
13.6/ 100
METRIC RATING
207th/ 347
METRIC RANK
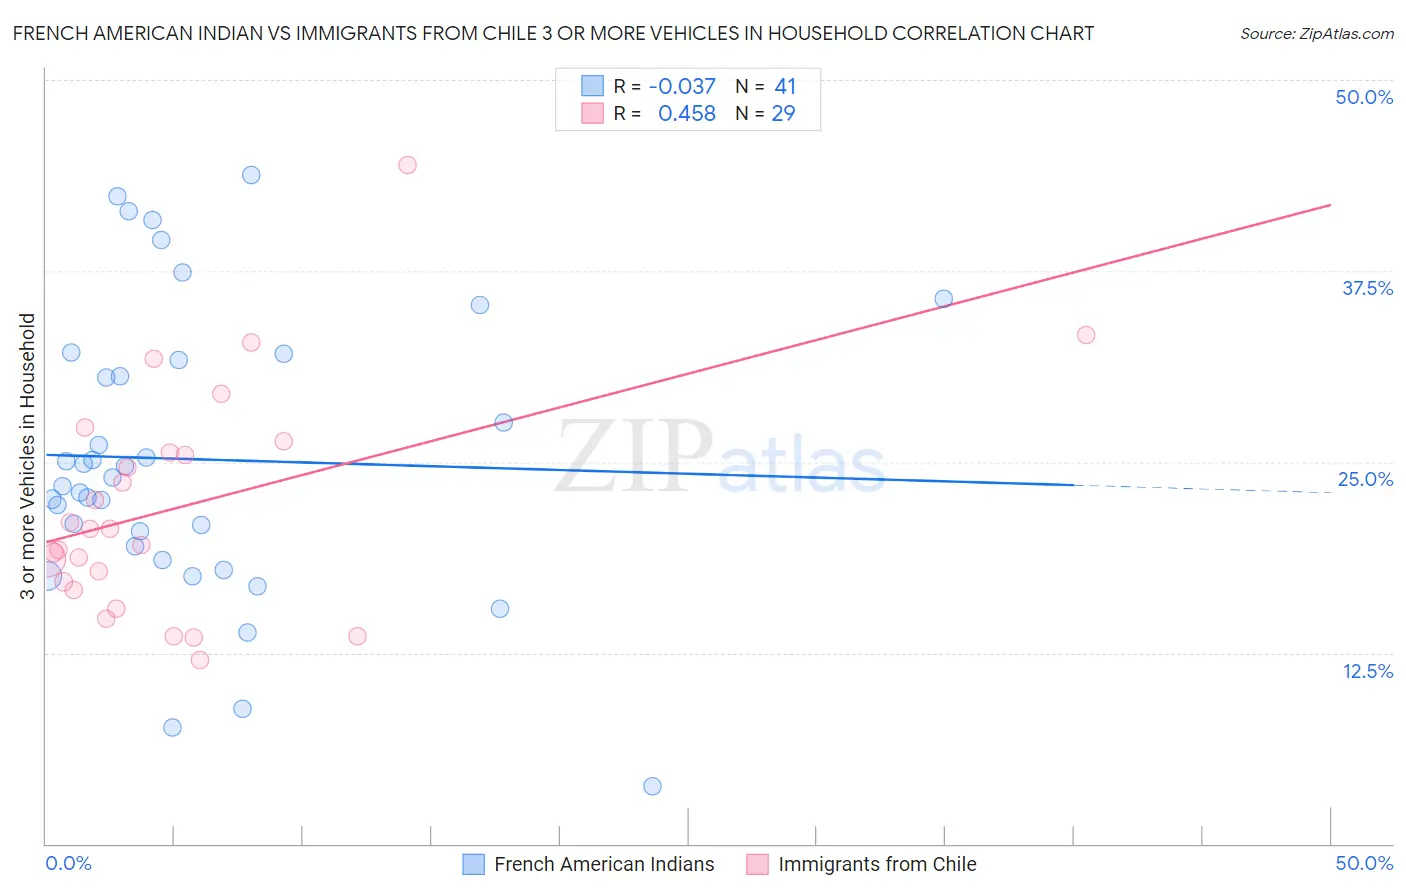
French American Indian vs Immigrants from Chile 3 or more Vehicles in Household Correlation Chart
The statistical analysis conducted on geographies consisting of 131,968,007 people shows no correlation between the proportion of French American Indians and percentage of households with 3 or more vehicles available in the United States with a correlation coefficient (R) of -0.037 and weighted average of 20.1%. Similarly, the statistical analysis conducted on geographies consisting of 218,586,627 people shows a moderate positive correlation between the proportion of Immigrants from Chile and percentage of households with 3 or more vehicles available in the United States with a correlation coefficient (R) of 0.458 and weighted average of 18.8%, a difference of 7.1%.
3 or more Vehicles in Household Correlation Summary
| Measurement | French American Indian | Immigrants from Chile |
| Minimum | 3.7% | 12.0% |
| Maximum | 43.8% | 44.4% |
| Range | 40.0% | 32.4% |
| Mean | 25.2% | 22.0% |
| Median | 24.0% | 20.6% |
| Interquartile 25% (IQ1) | 19.0% | 16.9% |
| Interquartile 75% (IQ3) | 31.9% | 26.0% |
| Interquartile Range (IQR) | 12.8% | 9.1% |
| Standard Deviation (Sample) | 9.5% | 7.3% |
| Standard Deviation (Population) | 9.4% | 7.2% |
Similar Demographics by 3 or more Vehicles in Household
Demographics Similar to French American Indians by 3 or more Vehicles in Household
In terms of 3 or more vehicles in household, the demographic groups most similar to French American Indians are Slovene (20.2%, a difference of 0.030%), Ottawa (20.1%, a difference of 0.060%), Jordanian (20.1%, a difference of 0.12%), Lithuanian (20.1%, a difference of 0.13%), and Aleut (20.2%, a difference of 0.15%).
| Demographics | Rating | Rank | 3 or more Vehicles in Household |
| Immigrants | North America | 87.8 /100 | #133 | Excellent 20.2% |
| Poles | 87.3 /100 | #134 | Excellent 20.2% |
| Immigrants | India | 87.2 /100 | #135 | Excellent 20.2% |
| Immigrants | Nicaragua | 87.1 /100 | #136 | Excellent 20.2% |
| Immigrants | Iraq | 87.1 /100 | #137 | Excellent 20.2% |
| Aleuts | 86.3 /100 | #138 | Excellent 20.2% |
| Slovenes | 85.5 /100 | #139 | Excellent 20.2% |
| French American Indians | 85.3 /100 | #140 | Excellent 20.1% |
| Ottawa | 84.9 /100 | #141 | Excellent 20.1% |
| Jordanians | 84.4 /100 | #142 | Excellent 20.1% |
| Lithuanians | 84.4 /100 | #143 | Excellent 20.1% |
| Iranians | 84.0 /100 | #144 | Excellent 20.1% |
| Palestinians | 83.9 /100 | #145 | Excellent 20.1% |
| Australians | 83.6 /100 | #146 | Excellent 20.1% |
| Slovaks | 83.0 /100 | #147 | Excellent 20.1% |
Demographics Similar to Immigrants from Chile by 3 or more Vehicles in Household
In terms of 3 or more vehicles in household, the demographic groups most similar to Immigrants from Chile are Immigrants from Burma/Myanmar (18.8%, a difference of 0.010%), Immigrants from Egypt (18.8%, a difference of 0.020%), Immigrants from Eastern Asia (18.8%, a difference of 0.080%), Russian (18.8%, a difference of 0.090%), and Bulgarian (18.8%, a difference of 0.10%).
| Demographics | Rating | Rank | 3 or more Vehicles in Household |
| Argentineans | 18.2 /100 | #200 | Poor 18.9% |
| Arabs | 17.7 /100 | #201 | Poor 18.9% |
| Immigrants | Austria | 15.4 /100 | #202 | Poor 18.9% |
| Tohono O'odham | 14.8 /100 | #203 | Poor 18.9% |
| Immigrants | Romania | 14.6 /100 | #204 | Poor 18.9% |
| Russians | 14.2 /100 | #205 | Poor 18.8% |
| Immigrants | Eastern Asia | 14.1 /100 | #206 | Poor 18.8% |
| Immigrants | Chile | 13.6 /100 | #207 | Poor 18.8% |
| Immigrants | Burma/Myanmar | 13.6 /100 | #208 | Poor 18.8% |
| Immigrants | Egypt | 13.5 /100 | #209 | Poor 18.8% |
| Bulgarians | 13.1 /100 | #210 | Poor 18.8% |
| Immigrants | Kenya | 12.4 /100 | #211 | Poor 18.8% |
| Panamanians | 11.6 /100 | #212 | Poor 18.8% |
| Immigrants | Cuba | 11.6 /100 | #213 | Poor 18.8% |
| Immigrants | Sierra Leone | 10.8 /100 | #214 | Poor 18.7% |