French American Indian vs Trinidadian and Tobagonian 3 or more Vehicles in Household
COMPARE
French American Indian
Trinidadian and Tobagonian
3 or more Vehicles in Household
3 or more Vehicles in Household Comparison
French American Indians
Trinidadians and Tobagonians
20.1%
3 OR MORE VEHICLES IN HOUSEHOLD
85.3/ 100
METRIC RATING
140th/ 347
METRIC RANK
13.6%
3 OR MORE VEHICLES IN HOUSEHOLD
0.0/ 100
METRIC RATING
332nd/ 347
METRIC RANK
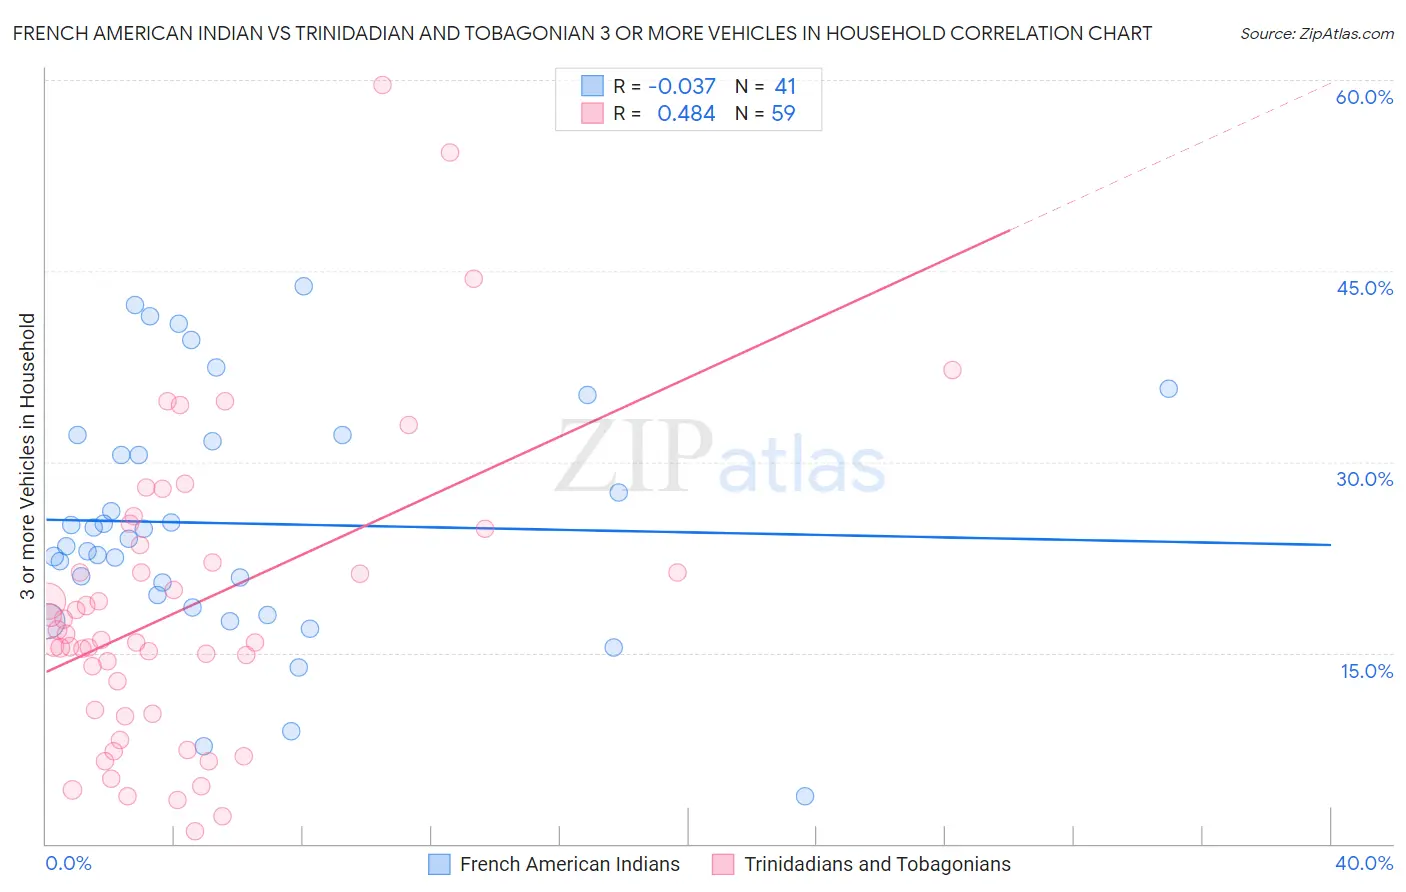
French American Indian vs Trinidadian and Tobagonian 3 or more Vehicles in Household Correlation Chart
The statistical analysis conducted on geographies consisting of 131,968,007 people shows no correlation between the proportion of French American Indians and percentage of households with 3 or more vehicles available in the United States with a correlation coefficient (R) of -0.037 and weighted average of 20.1%. Similarly, the statistical analysis conducted on geographies consisting of 219,661,129 people shows a moderate positive correlation between the proportion of Trinidadians and Tobagonians and percentage of households with 3 or more vehicles available in the United States with a correlation coefficient (R) of 0.484 and weighted average of 13.6%, a difference of 47.9%.
3 or more Vehicles in Household Correlation Summary
| Measurement | French American Indian | Trinidadian and Tobagonian |
| Minimum | 3.7% | 1.0% |
| Maximum | 43.8% | 59.6% |
| Range | 40.0% | 58.6% |
| Mean | 25.2% | 18.6% |
| Median | 24.0% | 16.0% |
| Interquartile 25% (IQ1) | 19.0% | 10.2% |
| Interquartile 75% (IQ3) | 31.9% | 23.5% |
| Interquartile Range (IQR) | 12.8% | 13.3% |
| Standard Deviation (Sample) | 9.5% | 11.9% |
| Standard Deviation (Population) | 9.4% | 11.8% |
Similar Demographics by 3 or more Vehicles in Household
Demographics Similar to French American Indians by 3 or more Vehicles in Household
In terms of 3 or more vehicles in household, the demographic groups most similar to French American Indians are Slovene (20.2%, a difference of 0.030%), Ottawa (20.1%, a difference of 0.060%), Jordanian (20.1%, a difference of 0.12%), Lithuanian (20.1%, a difference of 0.13%), and Aleut (20.2%, a difference of 0.15%).
| Demographics | Rating | Rank | 3 or more Vehicles in Household |
| Immigrants | North America | 87.8 /100 | #133 | Excellent 20.2% |
| Poles | 87.3 /100 | #134 | Excellent 20.2% |
| Immigrants | India | 87.2 /100 | #135 | Excellent 20.2% |
| Immigrants | Nicaragua | 87.1 /100 | #136 | Excellent 20.2% |
| Immigrants | Iraq | 87.1 /100 | #137 | Excellent 20.2% |
| Aleuts | 86.3 /100 | #138 | Excellent 20.2% |
| Slovenes | 85.5 /100 | #139 | Excellent 20.2% |
| French American Indians | 85.3 /100 | #140 | Excellent 20.1% |
| Ottawa | 84.9 /100 | #141 | Excellent 20.1% |
| Jordanians | 84.4 /100 | #142 | Excellent 20.1% |
| Lithuanians | 84.4 /100 | #143 | Excellent 20.1% |
| Iranians | 84.0 /100 | #144 | Excellent 20.1% |
| Palestinians | 83.9 /100 | #145 | Excellent 20.1% |
| Australians | 83.6 /100 | #146 | Excellent 20.1% |
| Slovaks | 83.0 /100 | #147 | Excellent 20.1% |
Demographics Similar to Trinidadians and Tobagonians by 3 or more Vehicles in Household
In terms of 3 or more vehicles in household, the demographic groups most similar to Trinidadians and Tobagonians are Immigrants from Cabo Verde (13.6%, a difference of 0.36%), Immigrants from Dominica (13.7%, a difference of 0.71%), West Indian (13.7%, a difference of 0.93%), Immigrants from Senegal (13.8%, a difference of 1.3%), and Immigrants from Ecuador (13.4%, a difference of 1.6%).
| Demographics | Rating | Rank | 3 or more Vehicles in Household |
| Senegalese | 0.0 /100 | #325 | Tragic 14.2% |
| Soviet Union | 0.0 /100 | #326 | Tragic 14.2% |
| Ecuadorians | 0.0 /100 | #327 | Tragic 14.1% |
| Immigrants | Albania | 0.0 /100 | #328 | Tragic 14.0% |
| Immigrants | Senegal | 0.0 /100 | #329 | Tragic 13.8% |
| West Indians | 0.0 /100 | #330 | Tragic 13.7% |
| Immigrants | Dominica | 0.0 /100 | #331 | Tragic 13.7% |
| Trinidadians and Tobagonians | 0.0 /100 | #332 | Tragic 13.6% |
| Immigrants | Cabo Verde | 0.0 /100 | #333 | Tragic 13.6% |
| Immigrants | Ecuador | 0.0 /100 | #334 | Tragic 13.4% |
| Immigrants | Trinidad and Tobago | 0.0 /100 | #335 | Tragic 13.3% |
| Barbadians | 0.0 /100 | #336 | Tragic 12.6% |
| Immigrants | Bangladesh | 0.0 /100 | #337 | Tragic 12.5% |
| Vietnamese | 0.0 /100 | #338 | Tragic 12.5% |
| Immigrants | Uzbekistan | 0.0 /100 | #339 | Tragic 12.0% |