French American Indian vs Jamaican 3 or more Vehicles in Household
COMPARE
French American Indian
Jamaican
3 or more Vehicles in Household
3 or more Vehicles in Household Comparison
French American Indians
Jamaicans
20.1%
3 OR MORE VEHICLES IN HOUSEHOLD
85.3/ 100
METRIC RATING
140th/ 347
METRIC RANK
15.2%
3 OR MORE VEHICLES IN HOUSEHOLD
0.0/ 100
METRIC RATING
317th/ 347
METRIC RANK
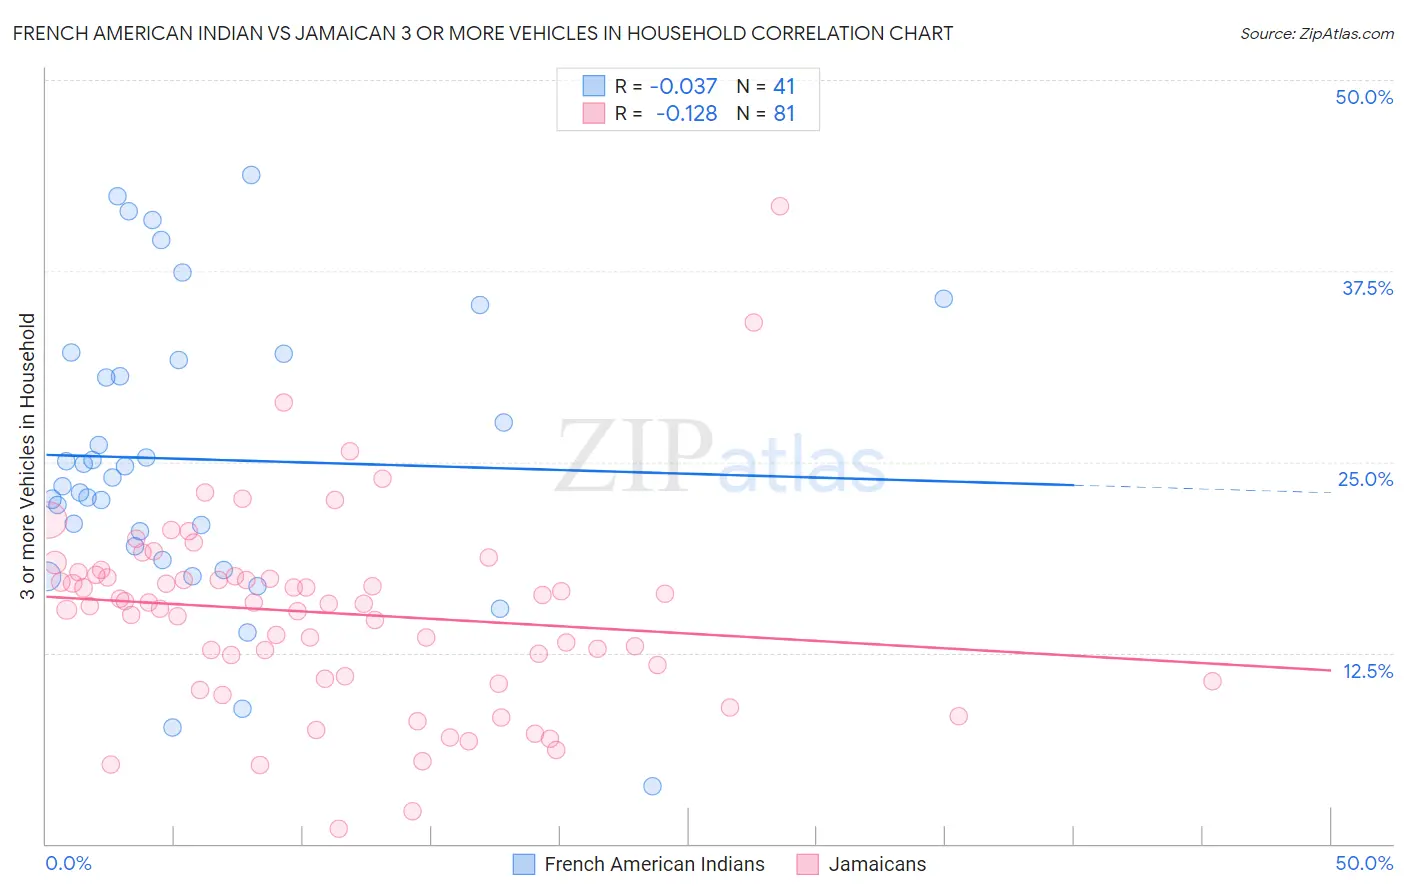
French American Indian vs Jamaican 3 or more Vehicles in Household Correlation Chart
The statistical analysis conducted on geographies consisting of 131,968,007 people shows no correlation between the proportion of French American Indians and percentage of households with 3 or more vehicles available in the United States with a correlation coefficient (R) of -0.037 and weighted average of 20.1%. Similarly, the statistical analysis conducted on geographies consisting of 367,542,736 people shows a poor negative correlation between the proportion of Jamaicans and percentage of households with 3 or more vehicles available in the United States with a correlation coefficient (R) of -0.128 and weighted average of 15.2%, a difference of 32.5%.
3 or more Vehicles in Household Correlation Summary
| Measurement | French American Indian | Jamaican |
| Minimum | 3.7% | 0.94% |
| Maximum | 43.8% | 41.8% |
| Range | 40.0% | 40.8% |
| Mean | 25.2% | 15.1% |
| Median | 24.0% | 15.7% |
| Interquartile 25% (IQ1) | 19.0% | 10.9% |
| Interquartile 75% (IQ3) | 31.9% | 17.6% |
| Interquartile Range (IQR) | 12.8% | 6.7% |
| Standard Deviation (Sample) | 9.5% | 6.5% |
| Standard Deviation (Population) | 9.4% | 6.4% |
Similar Demographics by 3 or more Vehicles in Household
Demographics Similar to French American Indians by 3 or more Vehicles in Household
In terms of 3 or more vehicles in household, the demographic groups most similar to French American Indians are Slovene (20.2%, a difference of 0.030%), Ottawa (20.1%, a difference of 0.060%), Jordanian (20.1%, a difference of 0.12%), Lithuanian (20.1%, a difference of 0.13%), and Aleut (20.2%, a difference of 0.15%).
| Demographics | Rating | Rank | 3 or more Vehicles in Household |
| Immigrants | North America | 87.8 /100 | #133 | Excellent 20.2% |
| Poles | 87.3 /100 | #134 | Excellent 20.2% |
| Immigrants | India | 87.2 /100 | #135 | Excellent 20.2% |
| Immigrants | Nicaragua | 87.1 /100 | #136 | Excellent 20.2% |
| Immigrants | Iraq | 87.1 /100 | #137 | Excellent 20.2% |
| Aleuts | 86.3 /100 | #138 | Excellent 20.2% |
| Slovenes | 85.5 /100 | #139 | Excellent 20.2% |
| French American Indians | 85.3 /100 | #140 | Excellent 20.1% |
| Ottawa | 84.9 /100 | #141 | Excellent 20.1% |
| Jordanians | 84.4 /100 | #142 | Excellent 20.1% |
| Lithuanians | 84.4 /100 | #143 | Excellent 20.1% |
| Iranians | 84.0 /100 | #144 | Excellent 20.1% |
| Palestinians | 83.9 /100 | #145 | Excellent 20.1% |
| Australians | 83.6 /100 | #146 | Excellent 20.1% |
| Slovaks | 83.0 /100 | #147 | Excellent 20.1% |
Demographics Similar to Jamaicans by 3 or more Vehicles in Household
In terms of 3 or more vehicles in household, the demographic groups most similar to Jamaicans are Immigrants from Haiti (15.2%, a difference of 0.20%), U.S. Virgin Islander (15.4%, a difference of 1.2%), Cape Verdean (15.0%, a difference of 1.4%), Haitian (15.5%, a difference of 1.7%), and Immigrants from Belarus (15.5%, a difference of 2.0%).
| Demographics | Rating | Rank | 3 or more Vehicles in Household |
| Moroccans | 0.0 /100 | #310 | Tragic 15.9% |
| Albanians | 0.0 /100 | #311 | Tragic 15.8% |
| Puerto Ricans | 0.0 /100 | #312 | Tragic 15.6% |
| Immigrants | Israel | 0.0 /100 | #313 | Tragic 15.6% |
| Immigrants | Belarus | 0.0 /100 | #314 | Tragic 15.5% |
| Haitians | 0.0 /100 | #315 | Tragic 15.5% |
| U.S. Virgin Islanders | 0.0 /100 | #316 | Tragic 15.4% |
| Jamaicans | 0.0 /100 | #317 | Tragic 15.2% |
| Immigrants | Haiti | 0.0 /100 | #318 | Tragic 15.2% |
| Cape Verdeans | 0.0 /100 | #319 | Tragic 15.0% |
| Yup'ik | 0.0 /100 | #320 | Tragic 14.8% |
| Immigrants | Jamaica | 0.0 /100 | #321 | Tragic 14.7% |
| Immigrants | West Indies | 0.0 /100 | #322 | Tragic 14.6% |
| Immigrants | Caribbean | 0.0 /100 | #323 | Tragic 14.6% |
| Immigrants | Yemen | 0.0 /100 | #324 | Tragic 14.2% |