French American Indian vs Immigrants from Morocco 3 or more Vehicles in Household
COMPARE
French American Indian
Immigrants from Morocco
3 or more Vehicles in Household
3 or more Vehicles in Household Comparison
French American Indians
Immigrants from Morocco
20.1%
3 OR MORE VEHICLES IN HOUSEHOLD
85.3/ 100
METRIC RATING
140th/ 347
METRIC RANK
16.3%
3 OR MORE VEHICLES IN HOUSEHOLD
0.0/ 100
METRIC RATING
305th/ 347
METRIC RANK
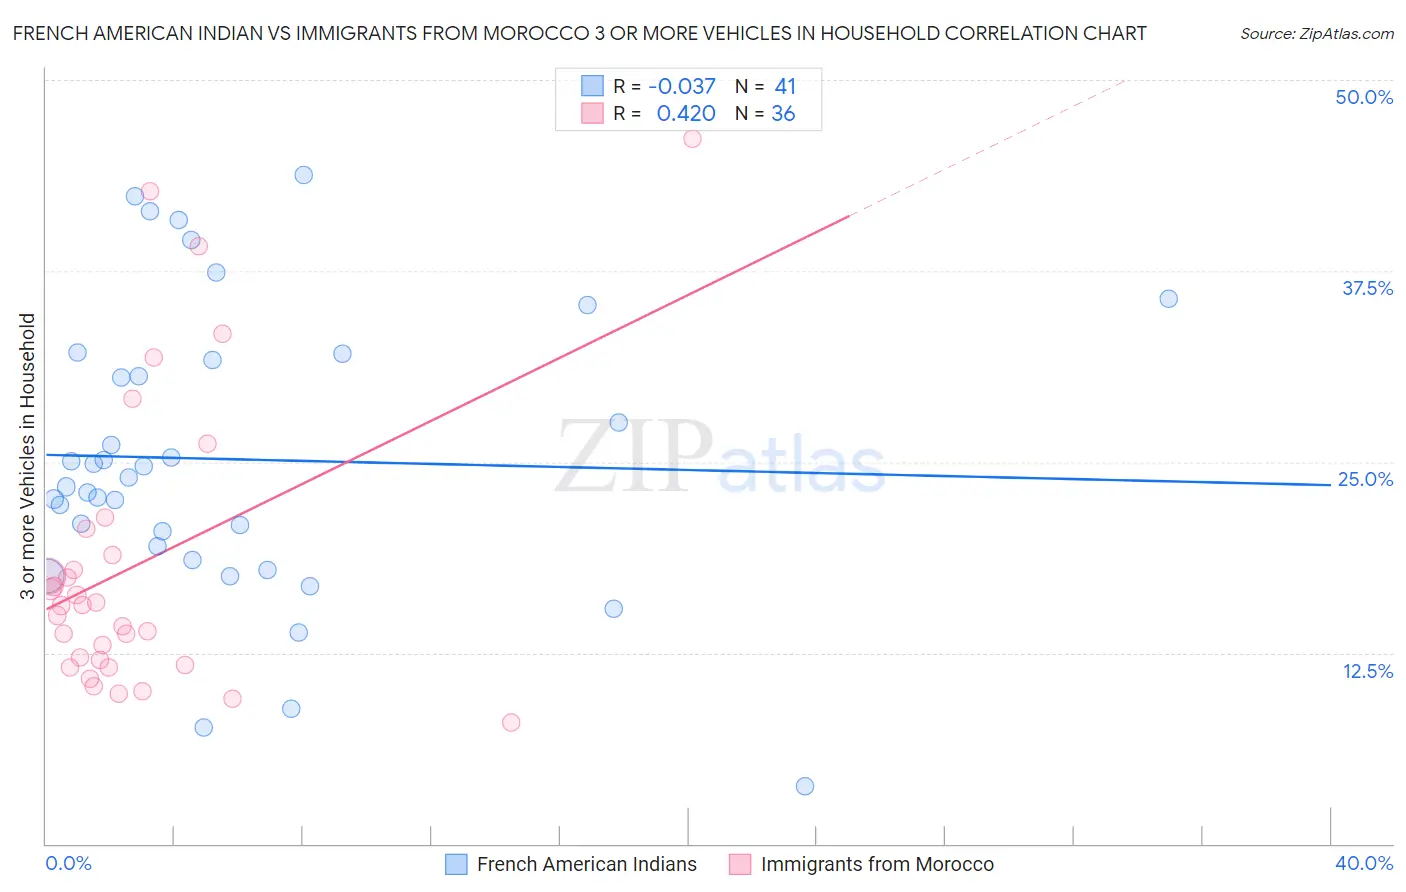
French American Indian vs Immigrants from Morocco 3 or more Vehicles in Household Correlation Chart
The statistical analysis conducted on geographies consisting of 131,968,007 people shows no correlation between the proportion of French American Indians and percentage of households with 3 or more vehicles available in the United States with a correlation coefficient (R) of -0.037 and weighted average of 20.1%. Similarly, the statistical analysis conducted on geographies consisting of 178,908,758 people shows a moderate positive correlation between the proportion of Immigrants from Morocco and percentage of households with 3 or more vehicles available in the United States with a correlation coefficient (R) of 0.420 and weighted average of 16.3%, a difference of 23.5%.
3 or more Vehicles in Household Correlation Summary
| Measurement | French American Indian | Immigrants from Morocco |
| Minimum | 3.7% | 7.9% |
| Maximum | 43.8% | 46.2% |
| Range | 40.0% | 38.2% |
| Mean | 25.2% | 18.3% |
| Median | 24.0% | 15.6% |
| Interquartile 25% (IQ1) | 19.0% | 11.8% |
| Interquartile 75% (IQ3) | 31.9% | 19.8% |
| Interquartile Range (IQR) | 12.8% | 8.0% |
| Standard Deviation (Sample) | 9.5% | 9.6% |
| Standard Deviation (Population) | 9.4% | 9.5% |
Similar Demographics by 3 or more Vehicles in Household
Demographics Similar to French American Indians by 3 or more Vehicles in Household
In terms of 3 or more vehicles in household, the demographic groups most similar to French American Indians are Slovene (20.2%, a difference of 0.030%), Ottawa (20.1%, a difference of 0.060%), Jordanian (20.1%, a difference of 0.12%), Lithuanian (20.1%, a difference of 0.13%), and Aleut (20.2%, a difference of 0.15%).
| Demographics | Rating | Rank | 3 or more Vehicles in Household |
| Immigrants | North America | 87.8 /100 | #133 | Excellent 20.2% |
| Poles | 87.3 /100 | #134 | Excellent 20.2% |
| Immigrants | India | 87.2 /100 | #135 | Excellent 20.2% |
| Immigrants | Nicaragua | 87.1 /100 | #136 | Excellent 20.2% |
| Immigrants | Iraq | 87.1 /100 | #137 | Excellent 20.2% |
| Aleuts | 86.3 /100 | #138 | Excellent 20.2% |
| Slovenes | 85.5 /100 | #139 | Excellent 20.2% |
| French American Indians | 85.3 /100 | #140 | Excellent 20.1% |
| Ottawa | 84.9 /100 | #141 | Excellent 20.1% |
| Jordanians | 84.4 /100 | #142 | Excellent 20.1% |
| Lithuanians | 84.4 /100 | #143 | Excellent 20.1% |
| Iranians | 84.0 /100 | #144 | Excellent 20.1% |
| Palestinians | 83.9 /100 | #145 | Excellent 20.1% |
| Australians | 83.6 /100 | #146 | Excellent 20.1% |
| Slovaks | 83.0 /100 | #147 | Excellent 20.1% |
Demographics Similar to Immigrants from Morocco by 3 or more Vehicles in Household
In terms of 3 or more vehicles in household, the demographic groups most similar to Immigrants from Morocco are Ghanaian (16.4%, a difference of 0.26%), Immigrants from Serbia (16.4%, a difference of 0.74%), Somali (16.2%, a difference of 0.82%), Immigrants from Ghana (16.2%, a difference of 0.96%), and Immigrants from Greece (16.5%, a difference of 1.0%).
| Demographics | Rating | Rank | 3 or more Vehicles in Household |
| Immigrants | Zaire | 0.1 /100 | #298 | Tragic 16.7% |
| Immigrants | South America | 0.1 /100 | #299 | Tragic 16.7% |
| Cypriots | 0.0 /100 | #300 | Tragic 16.6% |
| Paraguayans | 0.0 /100 | #301 | Tragic 16.6% |
| Immigrants | Greece | 0.0 /100 | #302 | Tragic 16.5% |
| Immigrants | Serbia | 0.0 /100 | #303 | Tragic 16.4% |
| Ghanaians | 0.0 /100 | #304 | Tragic 16.4% |
| Immigrants | Morocco | 0.0 /100 | #305 | Tragic 16.3% |
| Somalis | 0.0 /100 | #306 | Tragic 16.2% |
| Immigrants | Ghana | 0.0 /100 | #307 | Tragic 16.2% |
| Houma | 0.0 /100 | #308 | Tragic 16.1% |
| Immigrants | Somalia | 0.0 /100 | #309 | Tragic 15.9% |
| Moroccans | 0.0 /100 | #310 | Tragic 15.9% |
| Albanians | 0.0 /100 | #311 | Tragic 15.8% |
| Puerto Ricans | 0.0 /100 | #312 | Tragic 15.6% |