Malaysian vs Immigrants from Chile 3 or more Vehicles in Household
COMPARE
Malaysian
Immigrants from Chile
3 or more Vehicles in Household
3 or more Vehicles in Household Comparison
Malaysians
Immigrants from Chile
22.6%
3 OR MORE VEHICLES IN HOUSEHOLD
100.0/ 100
METRIC RATING
47th/ 347
METRIC RANK
18.8%
3 OR MORE VEHICLES IN HOUSEHOLD
13.6/ 100
METRIC RATING
207th/ 347
METRIC RANK
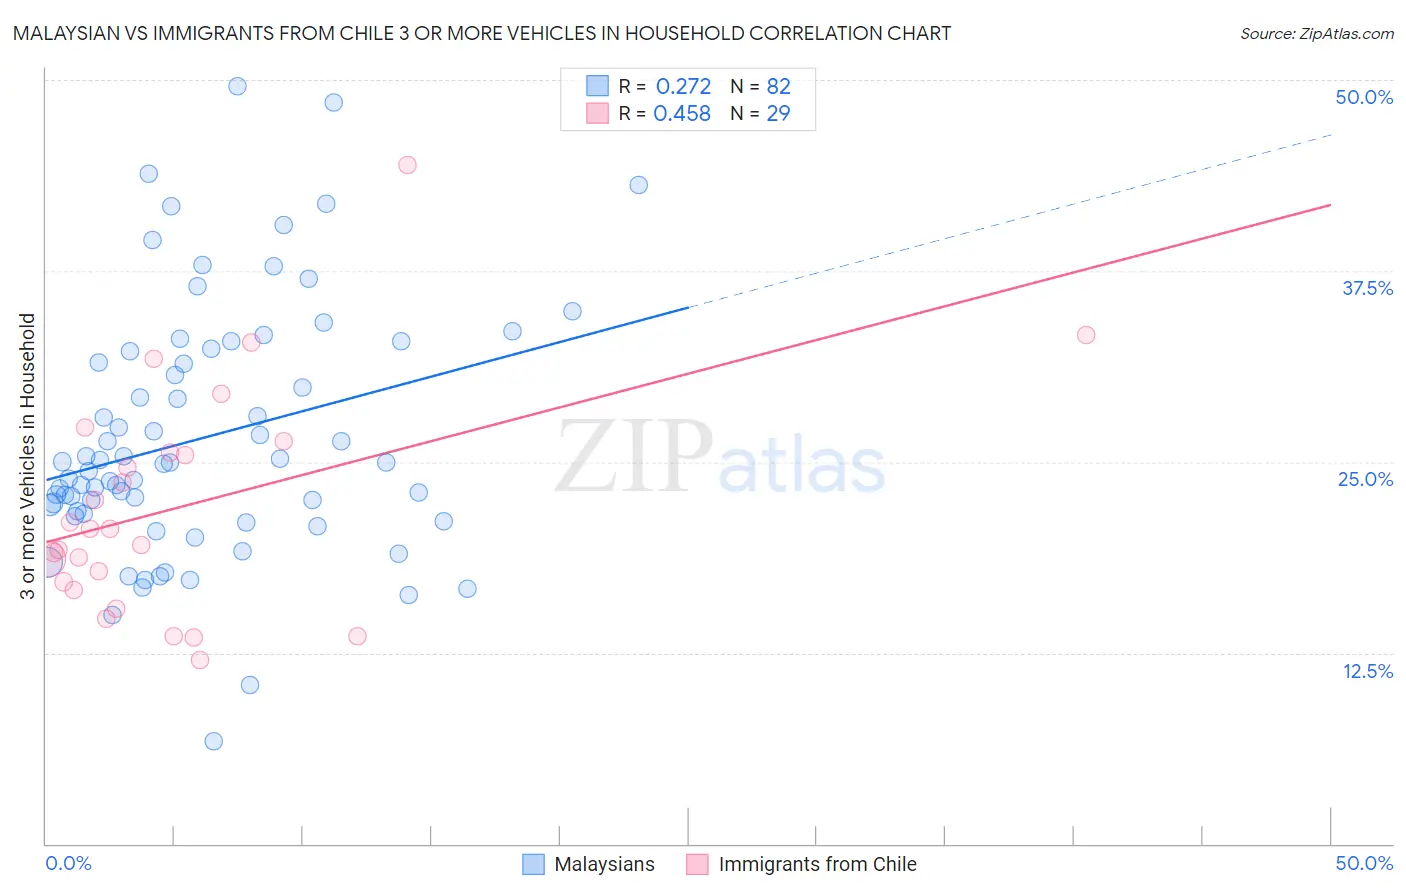
Malaysian vs Immigrants from Chile 3 or more Vehicles in Household Correlation Chart
The statistical analysis conducted on geographies consisting of 225,967,972 people shows a weak positive correlation between the proportion of Malaysians and percentage of households with 3 or more vehicles available in the United States with a correlation coefficient (R) of 0.272 and weighted average of 22.6%. Similarly, the statistical analysis conducted on geographies consisting of 218,586,627 people shows a moderate positive correlation between the proportion of Immigrants from Chile and percentage of households with 3 or more vehicles available in the United States with a correlation coefficient (R) of 0.458 and weighted average of 18.8%, a difference of 20.2%.
3 or more Vehicles in Household Correlation Summary
| Measurement | Malaysian | Immigrants from Chile |
| Minimum | 6.8% | 12.0% |
| Maximum | 49.6% | 44.4% |
| Range | 42.9% | 32.4% |
| Mean | 26.6% | 22.0% |
| Median | 24.9% | 20.6% |
| Interquartile 25% (IQ1) | 21.6% | 16.9% |
| Interquartile 75% (IQ3) | 32.2% | 26.0% |
| Interquartile Range (IQR) | 10.7% | 9.1% |
| Standard Deviation (Sample) | 8.3% | 7.3% |
| Standard Deviation (Population) | 8.2% | 7.2% |
Similar Demographics by 3 or more Vehicles in Household
Demographics Similar to Malaysians by 3 or more Vehicles in Household
In terms of 3 or more vehicles in household, the demographic groups most similar to Malaysians are American (22.6%, a difference of 0.010%), Scottish (22.6%, a difference of 0.010%), Scotch-Irish (22.6%, a difference of 0.11%), Sioux (22.6%, a difference of 0.17%), and White/Caucasian (22.6%, a difference of 0.18%).
| Demographics | Rating | Rank | 3 or more Vehicles in Household |
| Europeans | 100.0 /100 | #40 | Exceptional 22.9% |
| Germans | 100.0 /100 | #41 | Exceptional 22.7% |
| Natives/Alaskans | 100.0 /100 | #42 | Exceptional 22.7% |
| Osage | 100.0 /100 | #43 | Exceptional 22.7% |
| Cheyenne | 100.0 /100 | #44 | Exceptional 22.7% |
| Ute | 100.0 /100 | #45 | Exceptional 22.7% |
| Americans | 100.0 /100 | #46 | Exceptional 22.6% |
| Malaysians | 100.0 /100 | #47 | Exceptional 22.6% |
| Scottish | 100.0 /100 | #48 | Exceptional 22.6% |
| Scotch-Irish | 100.0 /100 | #49 | Exceptional 22.6% |
| Sioux | 100.0 /100 | #50 | Exceptional 22.6% |
| Whites/Caucasians | 100.0 /100 | #51 | Exceptional 22.6% |
| Welsh | 100.0 /100 | #52 | Exceptional 22.6% |
| Czechs | 100.0 /100 | #53 | Exceptional 22.5% |
| Crow | 100.0 /100 | #54 | Exceptional 22.5% |
Demographics Similar to Immigrants from Chile by 3 or more Vehicles in Household
In terms of 3 or more vehicles in household, the demographic groups most similar to Immigrants from Chile are Immigrants from Burma/Myanmar (18.8%, a difference of 0.010%), Immigrants from Egypt (18.8%, a difference of 0.020%), Immigrants from Eastern Asia (18.8%, a difference of 0.080%), Russian (18.8%, a difference of 0.090%), and Bulgarian (18.8%, a difference of 0.10%).
| Demographics | Rating | Rank | 3 or more Vehicles in Household |
| Argentineans | 18.2 /100 | #200 | Poor 18.9% |
| Arabs | 17.7 /100 | #201 | Poor 18.9% |
| Immigrants | Austria | 15.4 /100 | #202 | Poor 18.9% |
| Tohono O'odham | 14.8 /100 | #203 | Poor 18.9% |
| Immigrants | Romania | 14.6 /100 | #204 | Poor 18.9% |
| Russians | 14.2 /100 | #205 | Poor 18.8% |
| Immigrants | Eastern Asia | 14.1 /100 | #206 | Poor 18.8% |
| Immigrants | Chile | 13.6 /100 | #207 | Poor 18.8% |
| Immigrants | Burma/Myanmar | 13.6 /100 | #208 | Poor 18.8% |
| Immigrants | Egypt | 13.5 /100 | #209 | Poor 18.8% |
| Bulgarians | 13.1 /100 | #210 | Poor 18.8% |
| Immigrants | Kenya | 12.4 /100 | #211 | Poor 18.8% |
| Panamanians | 11.6 /100 | #212 | Poor 18.8% |
| Immigrants | Cuba | 11.6 /100 | #213 | Poor 18.8% |
| Immigrants | Sierra Leone | 10.8 /100 | #214 | Poor 18.7% |