Ukrainian vs Immigrants from Chile 3 or more Vehicles in Household
COMPARE
Ukrainian
Immigrants from Chile
3 or more Vehicles in Household
3 or more Vehicles in Household Comparison
Ukrainians
Immigrants from Chile
19.6%
3 OR MORE VEHICLES IN HOUSEHOLD
58.9/ 100
METRIC RATING
167th/ 347
METRIC RANK
18.8%
3 OR MORE VEHICLES IN HOUSEHOLD
13.6/ 100
METRIC RATING
207th/ 347
METRIC RANK
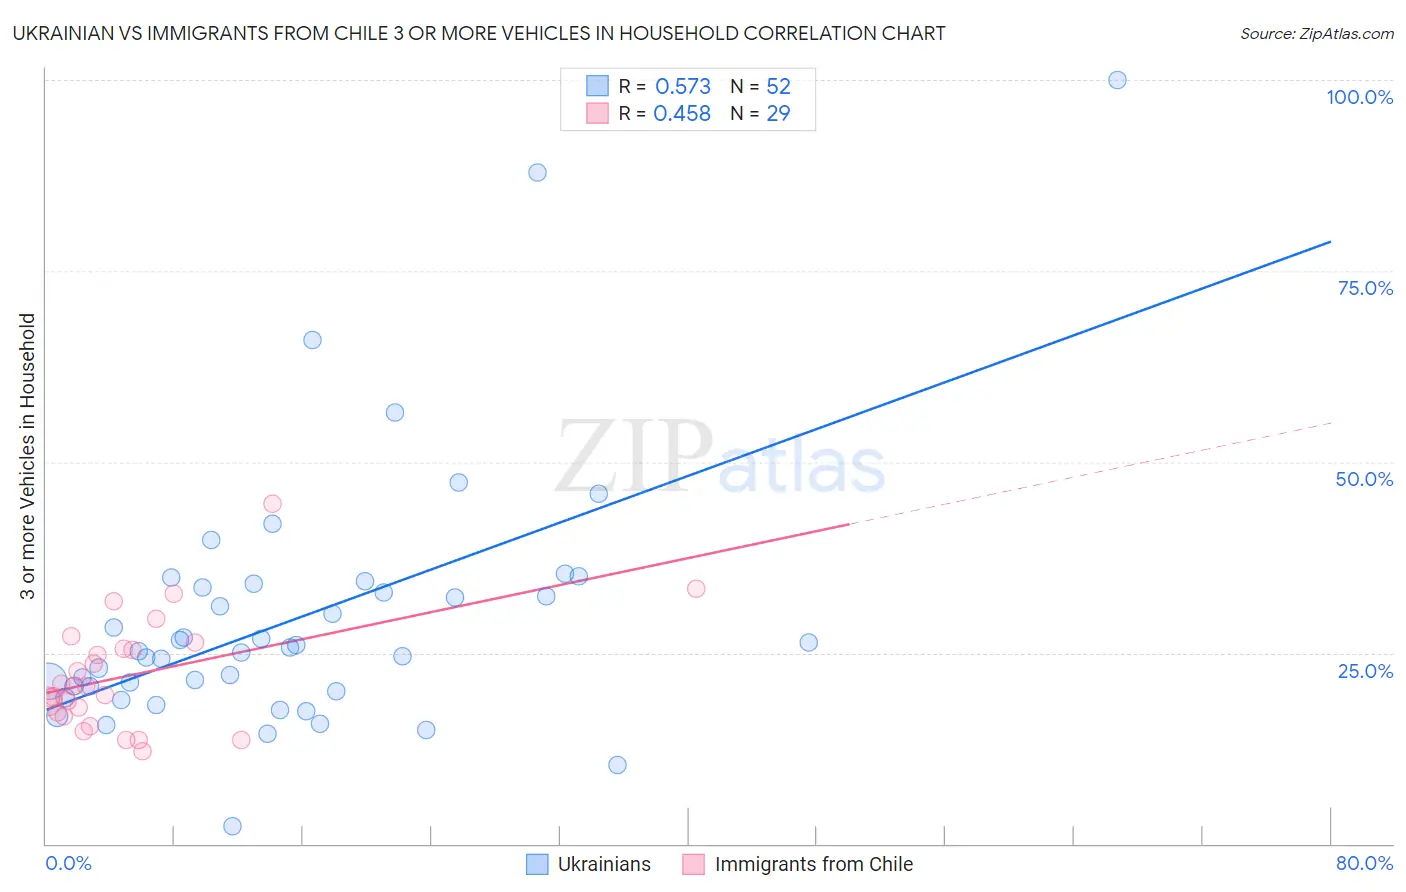
Ukrainian vs Immigrants from Chile 3 or more Vehicles in Household Correlation Chart
The statistical analysis conducted on geographies consisting of 448,145,260 people shows a substantial positive correlation between the proportion of Ukrainians and percentage of households with 3 or more vehicles available in the United States with a correlation coefficient (R) of 0.573 and weighted average of 19.6%. Similarly, the statistical analysis conducted on geographies consisting of 218,586,627 people shows a moderate positive correlation between the proportion of Immigrants from Chile and percentage of households with 3 or more vehicles available in the United States with a correlation coefficient (R) of 0.458 and weighted average of 18.8%, a difference of 4.3%.
3 or more Vehicles in Household Correlation Summary
| Measurement | Ukrainian | Immigrants from Chile |
| Minimum | 2.3% | 12.0% |
| Maximum | 100.0% | 44.4% |
| Range | 97.7% | 32.4% |
| Mean | 29.5% | 22.0% |
| Median | 25.5% | 20.6% |
| Interquartile 25% (IQ1) | 20.3% | 16.9% |
| Interquartile 75% (IQ3) | 33.8% | 26.0% |
| Interquartile Range (IQR) | 13.5% | 9.1% |
| Standard Deviation (Sample) | 17.1% | 7.3% |
| Standard Deviation (Population) | 17.0% | 7.2% |
Similar Demographics by 3 or more Vehicles in Household
Demographics Similar to Ukrainians by 3 or more Vehicles in Household
In terms of 3 or more vehicles in household, the demographic groups most similar to Ukrainians are Peruvian (19.6%, a difference of 0.010%), Immigrants from Denmark (19.6%, a difference of 0.10%), Immigrants from Cameroon (19.7%, a difference of 0.16%), Iraqi (19.6%, a difference of 0.22%), and Immigrants from Costa Rica (19.7%, a difference of 0.24%).
| Demographics | Rating | Rank | 3 or more Vehicles in Household |
| Immigrants | Lebanon | 67.6 /100 | #160 | Good 19.8% |
| Immigrants | Guatemala | 65.6 /100 | #161 | Good 19.7% |
| Estonians | 63.2 /100 | #162 | Good 19.7% |
| Chileans | 63.0 /100 | #163 | Good 19.7% |
| Yugoslavians | 62.9 /100 | #164 | Good 19.7% |
| Immigrants | Costa Rica | 61.9 /100 | #165 | Good 19.7% |
| Immigrants | Cameroon | 60.9 /100 | #166 | Good 19.7% |
| Ukrainians | 58.9 /100 | #167 | Average 19.6% |
| Peruvians | 58.8 /100 | #168 | Average 19.6% |
| Immigrants | Denmark | 57.6 /100 | #169 | Average 19.6% |
| Iraqis | 56.0 /100 | #170 | Average 19.6% |
| Immigrants | Western Europe | 53.2 /100 | #171 | Average 19.5% |
| Kiowa | 50.9 /100 | #172 | Average 19.5% |
| Immigrants | Northern Europe | 50.2 /100 | #173 | Average 19.5% |
| Immigrants | South Africa | 50.0 /100 | #174 | Average 19.5% |
Demographics Similar to Immigrants from Chile by 3 or more Vehicles in Household
In terms of 3 or more vehicles in household, the demographic groups most similar to Immigrants from Chile are Immigrants from Burma/Myanmar (18.8%, a difference of 0.010%), Immigrants from Egypt (18.8%, a difference of 0.020%), Immigrants from Eastern Asia (18.8%, a difference of 0.080%), Russian (18.8%, a difference of 0.090%), and Bulgarian (18.8%, a difference of 0.10%).
| Demographics | Rating | Rank | 3 or more Vehicles in Household |
| Argentineans | 18.2 /100 | #200 | Poor 18.9% |
| Arabs | 17.7 /100 | #201 | Poor 18.9% |
| Immigrants | Austria | 15.4 /100 | #202 | Poor 18.9% |
| Tohono O'odham | 14.8 /100 | #203 | Poor 18.9% |
| Immigrants | Romania | 14.6 /100 | #204 | Poor 18.9% |
| Russians | 14.2 /100 | #205 | Poor 18.8% |
| Immigrants | Eastern Asia | 14.1 /100 | #206 | Poor 18.8% |
| Immigrants | Chile | 13.6 /100 | #207 | Poor 18.8% |
| Immigrants | Burma/Myanmar | 13.6 /100 | #208 | Poor 18.8% |
| Immigrants | Egypt | 13.5 /100 | #209 | Poor 18.8% |
| Bulgarians | 13.1 /100 | #210 | Poor 18.8% |
| Immigrants | Kenya | 12.4 /100 | #211 | Poor 18.8% |
| Panamanians | 11.6 /100 | #212 | Poor 18.8% |
| Immigrants | Cuba | 11.6 /100 | #213 | Poor 18.8% |
| Immigrants | Sierra Leone | 10.8 /100 | #214 | Poor 18.7% |