Belizean vs Bangladeshi 3 or more Vehicles in Household
COMPARE
Belizean
Bangladeshi
3 or more Vehicles in Household
3 or more Vehicles in Household Comparison
Belizeans
Bangladeshis
18.6%
3 OR MORE VEHICLES IN HOUSEHOLD
7.3/ 100
METRIC RATING
222nd/ 347
METRIC RANK
21.9%
3 OR MORE VEHICLES IN HOUSEHOLD
99.8/ 100
METRIC RATING
70th/ 347
METRIC RANK
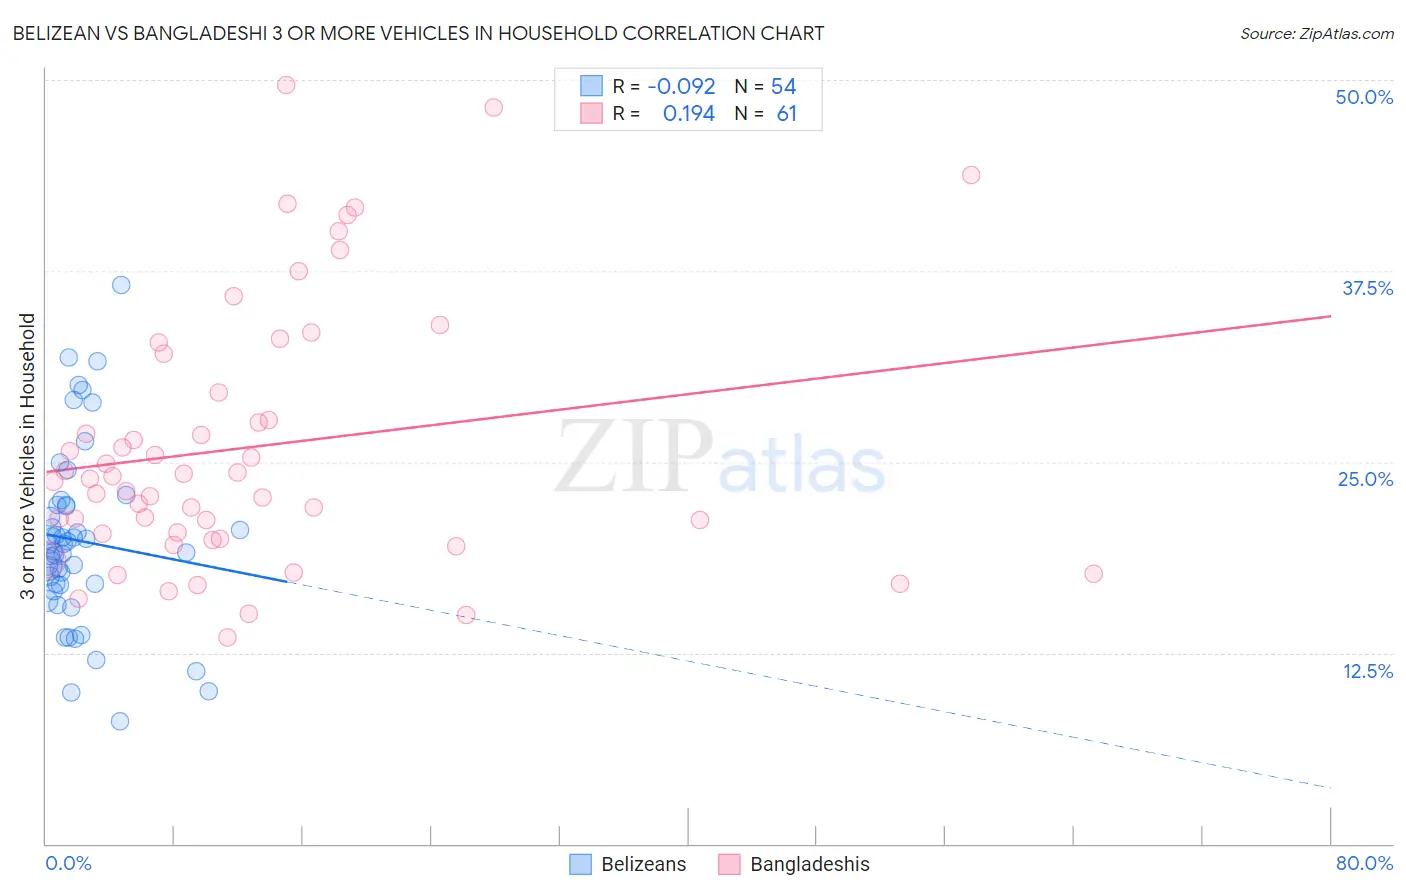
Belizean vs Bangladeshi 3 or more Vehicles in Household Correlation Chart
The statistical analysis conducted on geographies consisting of 144,156,890 people shows a slight negative correlation between the proportion of Belizeans and percentage of households with 3 or more vehicles available in the United States with a correlation coefficient (R) of -0.092 and weighted average of 18.6%. Similarly, the statistical analysis conducted on geographies consisting of 141,336,310 people shows a poor positive correlation between the proportion of Bangladeshis and percentage of households with 3 or more vehicles available in the United States with a correlation coefficient (R) of 0.194 and weighted average of 21.9%, a difference of 17.8%.
3 or more Vehicles in Household Correlation Summary
| Measurement | Belizean | Bangladeshi |
| Minimum | 8.0% | 13.5% |
| Maximum | 36.6% | 49.7% |
| Range | 28.6% | 36.1% |
| Mean | 19.8% | 26.0% |
| Median | 19.4% | 23.9% |
| Interquartile 25% (IQ1) | 17.0% | 20.1% |
| Interquartile 75% (IQ3) | 22.2% | 30.8% |
| Interquartile Range (IQR) | 5.2% | 10.7% |
| Standard Deviation (Sample) | 5.8% | 8.6% |
| Standard Deviation (Population) | 5.8% | 8.5% |
Similar Demographics by 3 or more Vehicles in Household
Demographics Similar to Belizeans by 3 or more Vehicles in Household
In terms of 3 or more vehicles in household, the demographic groups most similar to Belizeans are Immigrants from Poland (18.6%, a difference of 0.050%), Nigerian (18.6%, a difference of 0.15%), Immigrants from Armenia (18.6%, a difference of 0.34%), Immigrants from Portugal (18.6%, a difference of 0.43%), and Immigrants from Czechoslovakia (18.5%, a difference of 0.47%).
| Demographics | Rating | Rank | 3 or more Vehicles in Household |
| Eastern Europeans | 10.6 /100 | #215 | Poor 18.7% |
| Immigrants | Nigeria | 10.3 /100 | #216 | Poor 18.7% |
| Immigrants | Italy | 10.2 /100 | #217 | Poor 18.7% |
| Immigrants | Portugal | 8.9 /100 | #218 | Tragic 18.6% |
| Immigrants | Armenia | 8.6 /100 | #219 | Tragic 18.6% |
| Nigerians | 7.9 /100 | #220 | Tragic 18.6% |
| Immigrants | Poland | 7.5 /100 | #221 | Tragic 18.6% |
| Belizeans | 7.3 /100 | #222 | Tragic 18.6% |
| Immigrants | Czechoslovakia | 5.9 /100 | #223 | Tragic 18.5% |
| Immigrants | Argentina | 5.6 /100 | #224 | Tragic 18.5% |
| Immigrants | Lithuania | 5.6 /100 | #225 | Tragic 18.5% |
| Immigrants | Hungary | 5.5 /100 | #226 | Tragic 18.5% |
| Immigrants | Singapore | 5.4 /100 | #227 | Tragic 18.4% |
| Turks | 5.4 /100 | #228 | Tragic 18.4% |
| Immigrants | Switzerland | 5.0 /100 | #229 | Tragic 18.4% |
Demographics Similar to Bangladeshis by 3 or more Vehicles in Household
In terms of 3 or more vehicles in household, the demographic groups most similar to Bangladeshis are Potawatomi (21.9%, a difference of 0.010%), Creek (21.9%, a difference of 0.19%), Portuguese (21.8%, a difference of 0.19%), British (21.9%, a difference of 0.22%), and Salvadoran (21.8%, a difference of 0.28%).
| Demographics | Rating | Rank | 3 or more Vehicles in Household |
| Chickasaw | 99.9 /100 | #63 | Exceptional 22.2% |
| Immigrants | Taiwan | 99.9 /100 | #64 | Exceptional 22.1% |
| Pima | 99.9 /100 | #65 | Exceptional 22.0% |
| Northern Europeans | 99.9 /100 | #66 | Exceptional 22.0% |
| Alaskan Athabascans | 99.9 /100 | #67 | Exceptional 21.9% |
| British | 99.9 /100 | #68 | Exceptional 21.9% |
| Creek | 99.9 /100 | #69 | Exceptional 21.9% |
| Bangladeshis | 99.8 /100 | #70 | Exceptional 21.9% |
| Potawatomi | 99.8 /100 | #71 | Exceptional 21.9% |
| Portuguese | 99.8 /100 | #72 | Exceptional 21.8% |
| Salvadorans | 99.8 /100 | #73 | Exceptional 21.8% |
| Immigrants | Oceania | 99.8 /100 | #74 | Exceptional 21.8% |
| Japanese | 99.8 /100 | #75 | Exceptional 21.8% |
| Immigrants | Nonimmigrants | 99.8 /100 | #76 | Exceptional 21.8% |
| Irish | 99.8 /100 | #77 | Exceptional 21.8% |