Argentinean vs Bangladeshi 3 or more Vehicles in Household
COMPARE
Argentinean
Bangladeshi
3 or more Vehicles in Household
3 or more Vehicles in Household Comparison
Argentineans
Bangladeshis
18.9%
3 OR MORE VEHICLES IN HOUSEHOLD
18.2/ 100
METRIC RATING
200th/ 347
METRIC RANK
21.9%
3 OR MORE VEHICLES IN HOUSEHOLD
99.8/ 100
METRIC RATING
70th/ 347
METRIC RANK
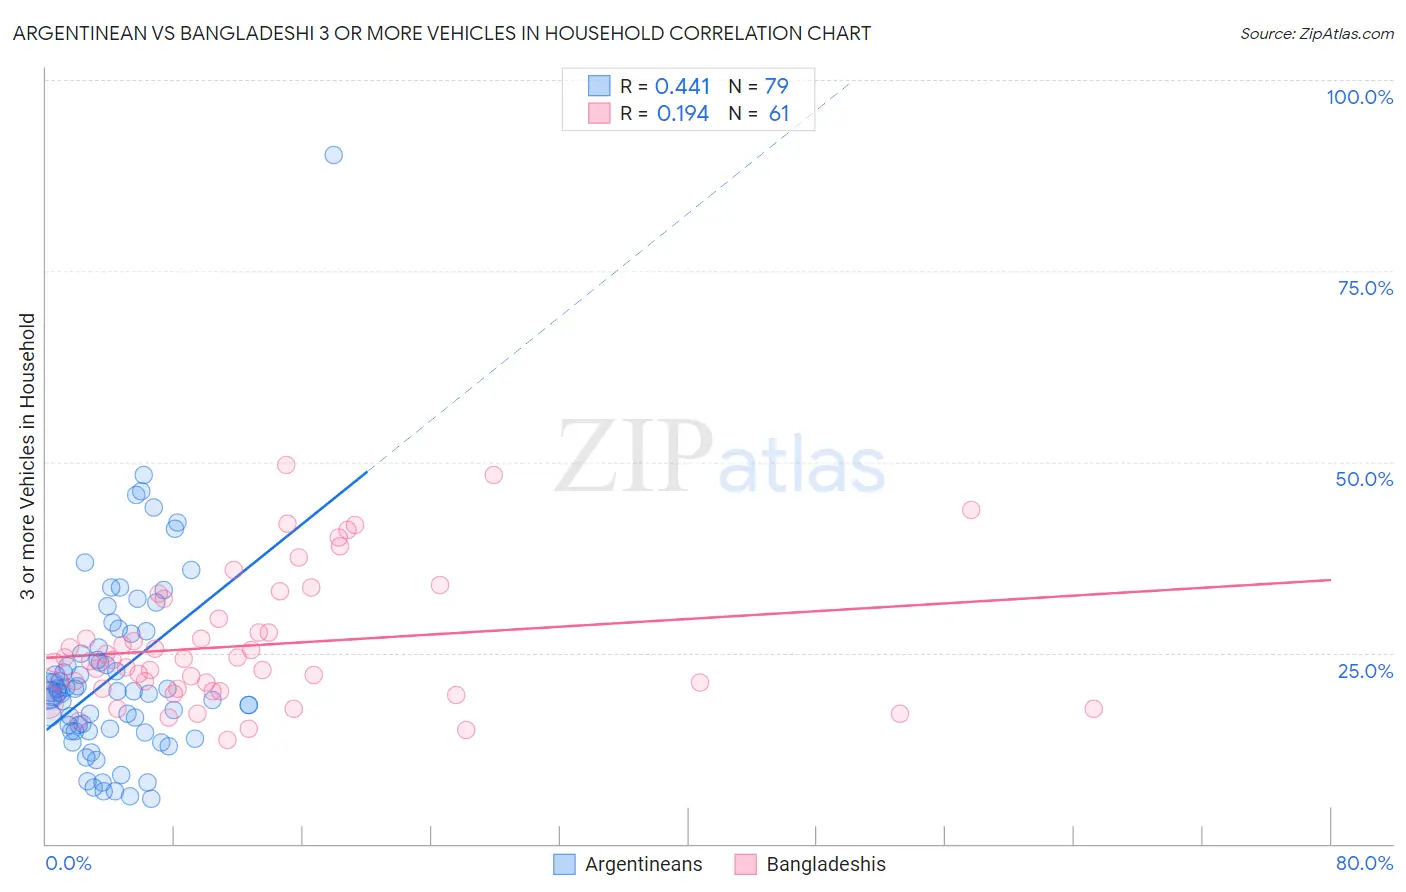
Argentinean vs Bangladeshi 3 or more Vehicles in Household Correlation Chart
The statistical analysis conducted on geographies consisting of 296,926,248 people shows a moderate positive correlation between the proportion of Argentineans and percentage of households with 3 or more vehicles available in the United States with a correlation coefficient (R) of 0.441 and weighted average of 18.9%. Similarly, the statistical analysis conducted on geographies consisting of 141,336,310 people shows a poor positive correlation between the proportion of Bangladeshis and percentage of households with 3 or more vehicles available in the United States with a correlation coefficient (R) of 0.194 and weighted average of 21.9%, a difference of 15.4%.
3 or more Vehicles in Household Correlation Summary
| Measurement | Argentinean | Bangladeshi |
| Minimum | 6.0% | 13.5% |
| Maximum | 90.2% | 49.7% |
| Range | 84.2% | 36.1% |
| Mean | 22.1% | 26.0% |
| Median | 19.9% | 23.9% |
| Interquartile 25% (IQ1) | 14.8% | 20.1% |
| Interquartile 75% (IQ3) | 25.6% | 30.8% |
| Interquartile Range (IQR) | 10.8% | 10.7% |
| Standard Deviation (Sample) | 12.5% | 8.6% |
| Standard Deviation (Population) | 12.4% | 8.5% |
Similar Demographics by 3 or more Vehicles in Household
Demographics Similar to Argentineans by 3 or more Vehicles in Household
In terms of 3 or more vehicles in household, the demographic groups most similar to Argentineans are Arab (18.9%, a difference of 0.060%), Immigrants from Norway (19.0%, a difference of 0.10%), Egyptian (19.0%, a difference of 0.17%), Immigrants from Austria (18.9%, a difference of 0.39%), and Immigrants from Japan (19.0%, a difference of 0.46%).
| Demographics | Rating | Rank | 3 or more Vehicles in Household |
| Tsimshian | 24.4 /100 | #193 | Fair 19.1% |
| Serbians | 24.0 /100 | #194 | Fair 19.1% |
| Immigrants | Moldova | 23.6 /100 | #195 | Fair 19.1% |
| Central American Indians | 22.2 /100 | #196 | Fair 19.0% |
| Immigrants | Japan | 22.0 /100 | #197 | Fair 19.0% |
| Egyptians | 19.5 /100 | #198 | Poor 19.0% |
| Immigrants | Norway | 19.0 /100 | #199 | Poor 19.0% |
| Argentineans | 18.2 /100 | #200 | Poor 18.9% |
| Arabs | 17.7 /100 | #201 | Poor 18.9% |
| Immigrants | Austria | 15.4 /100 | #202 | Poor 18.9% |
| Tohono O'odham | 14.8 /100 | #203 | Poor 18.9% |
| Immigrants | Romania | 14.6 /100 | #204 | Poor 18.9% |
| Russians | 14.2 /100 | #205 | Poor 18.8% |
| Immigrants | Eastern Asia | 14.1 /100 | #206 | Poor 18.8% |
| Immigrants | Chile | 13.6 /100 | #207 | Poor 18.8% |
Demographics Similar to Bangladeshis by 3 or more Vehicles in Household
In terms of 3 or more vehicles in household, the demographic groups most similar to Bangladeshis are Potawatomi (21.9%, a difference of 0.010%), Creek (21.9%, a difference of 0.19%), Portuguese (21.8%, a difference of 0.19%), British (21.9%, a difference of 0.22%), and Salvadoran (21.8%, a difference of 0.28%).
| Demographics | Rating | Rank | 3 or more Vehicles in Household |
| Chickasaw | 99.9 /100 | #63 | Exceptional 22.2% |
| Immigrants | Taiwan | 99.9 /100 | #64 | Exceptional 22.1% |
| Pima | 99.9 /100 | #65 | Exceptional 22.0% |
| Northern Europeans | 99.9 /100 | #66 | Exceptional 22.0% |
| Alaskan Athabascans | 99.9 /100 | #67 | Exceptional 21.9% |
| British | 99.9 /100 | #68 | Exceptional 21.9% |
| Creek | 99.9 /100 | #69 | Exceptional 21.9% |
| Bangladeshis | 99.8 /100 | #70 | Exceptional 21.9% |
| Potawatomi | 99.8 /100 | #71 | Exceptional 21.9% |
| Portuguese | 99.8 /100 | #72 | Exceptional 21.8% |
| Salvadorans | 99.8 /100 | #73 | Exceptional 21.8% |
| Immigrants | Oceania | 99.8 /100 | #74 | Exceptional 21.8% |
| Japanese | 99.8 /100 | #75 | Exceptional 21.8% |
| Immigrants | Nonimmigrants | 99.8 /100 | #76 | Exceptional 21.8% |
| Irish | 99.8 /100 | #77 | Exceptional 21.8% |