Belizean vs Apache 3 or more Vehicles in Household
COMPARE
Belizean
Apache
3 or more Vehicles in Household
3 or more Vehicles in Household Comparison
Belizeans
Apache
18.6%
3 OR MORE VEHICLES IN HOUSEHOLD
7.3/ 100
METRIC RATING
222nd/ 347
METRIC RANK
21.2%
3 OR MORE VEHICLES IN HOUSEHOLD
98.9/ 100
METRIC RATING
92nd/ 347
METRIC RANK
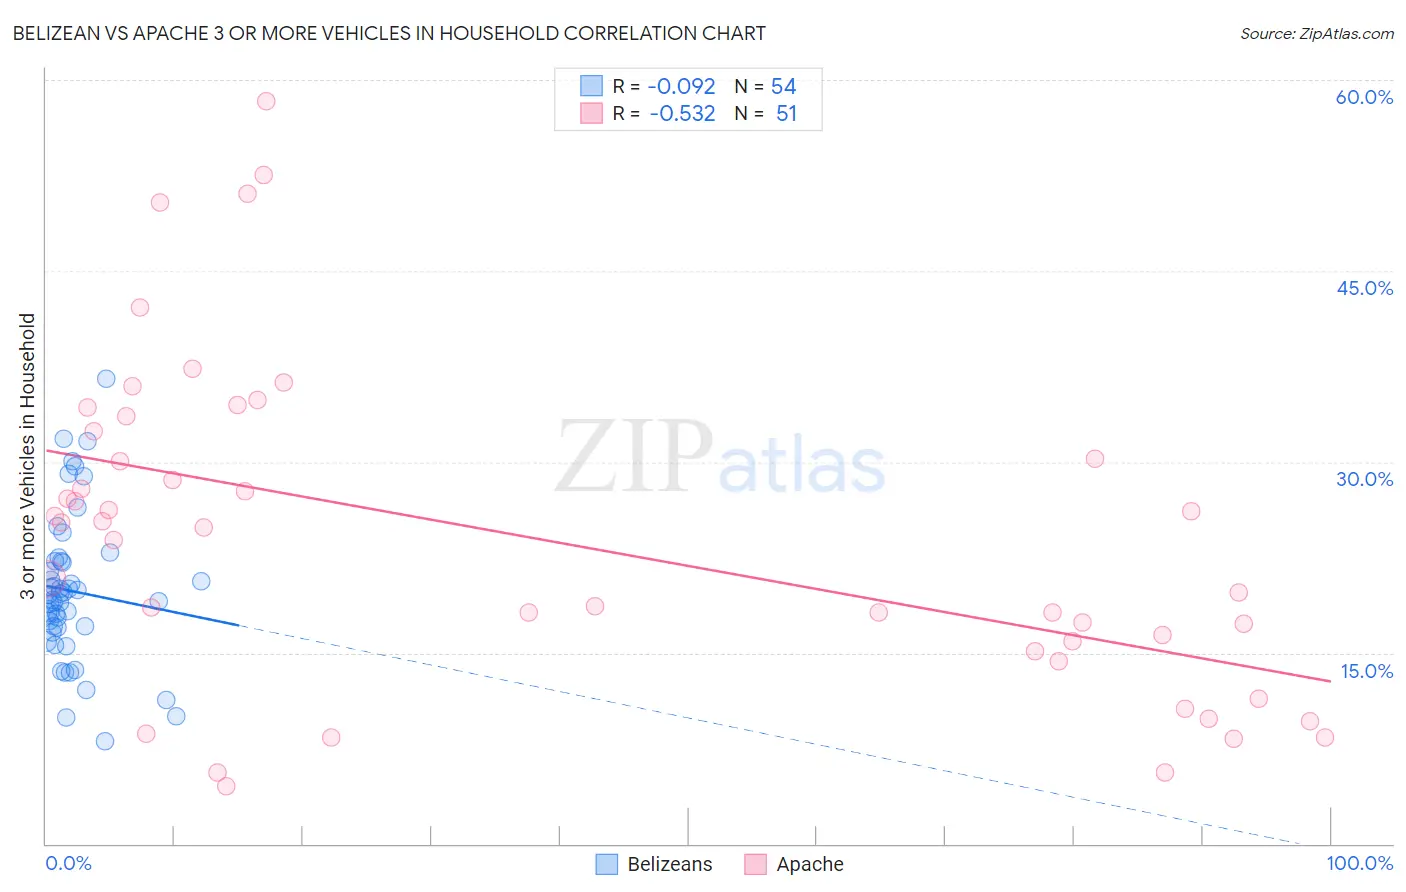
Belizean vs Apache 3 or more Vehicles in Household Correlation Chart
The statistical analysis conducted on geographies consisting of 144,156,890 people shows a slight negative correlation between the proportion of Belizeans and percentage of households with 3 or more vehicles available in the United States with a correlation coefficient (R) of -0.092 and weighted average of 18.6%. Similarly, the statistical analysis conducted on geographies consisting of 231,026,513 people shows a substantial negative correlation between the proportion of Apache and percentage of households with 3 or more vehicles available in the United States with a correlation coefficient (R) of -0.532 and weighted average of 21.2%, a difference of 14.0%.
3 or more Vehicles in Household Correlation Summary
| Measurement | Belizean | Apache |
| Minimum | 8.0% | 4.5% |
| Maximum | 36.6% | 58.3% |
| Range | 28.6% | 53.9% |
| Mean | 19.8% | 24.1% |
| Median | 19.4% | 24.8% |
| Interquartile 25% (IQ1) | 17.0% | 15.1% |
| Interquartile 75% (IQ3) | 22.2% | 32.4% |
| Interquartile Range (IQR) | 5.2% | 17.3% |
| Standard Deviation (Sample) | 5.8% | 12.8% |
| Standard Deviation (Population) | 5.8% | 12.7% |
Similar Demographics by 3 or more Vehicles in Household
Demographics Similar to Belizeans by 3 or more Vehicles in Household
In terms of 3 or more vehicles in household, the demographic groups most similar to Belizeans are Immigrants from Poland (18.6%, a difference of 0.050%), Nigerian (18.6%, a difference of 0.15%), Immigrants from Armenia (18.6%, a difference of 0.34%), Immigrants from Portugal (18.6%, a difference of 0.43%), and Immigrants from Czechoslovakia (18.5%, a difference of 0.47%).
| Demographics | Rating | Rank | 3 or more Vehicles in Household |
| Eastern Europeans | 10.6 /100 | #215 | Poor 18.7% |
| Immigrants | Nigeria | 10.3 /100 | #216 | Poor 18.7% |
| Immigrants | Italy | 10.2 /100 | #217 | Poor 18.7% |
| Immigrants | Portugal | 8.9 /100 | #218 | Tragic 18.6% |
| Immigrants | Armenia | 8.6 /100 | #219 | Tragic 18.6% |
| Nigerians | 7.9 /100 | #220 | Tragic 18.6% |
| Immigrants | Poland | 7.5 /100 | #221 | Tragic 18.6% |
| Belizeans | 7.3 /100 | #222 | Tragic 18.6% |
| Immigrants | Czechoslovakia | 5.9 /100 | #223 | Tragic 18.5% |
| Immigrants | Argentina | 5.6 /100 | #224 | Tragic 18.5% |
| Immigrants | Lithuania | 5.6 /100 | #225 | Tragic 18.5% |
| Immigrants | Hungary | 5.5 /100 | #226 | Tragic 18.5% |
| Immigrants | Singapore | 5.4 /100 | #227 | Tragic 18.4% |
| Turks | 5.4 /100 | #228 | Tragic 18.4% |
| Immigrants | Switzerland | 5.0 /100 | #229 | Tragic 18.4% |
Demographics Similar to Apache by 3 or more Vehicles in Household
In terms of 3 or more vehicles in household, the demographic groups most similar to Apache are Belgian (21.2%, a difference of 0.080%), Immigrants from Indonesia (21.1%, a difference of 0.20%), Immigrants from Afghanistan (21.2%, a difference of 0.41%), Immigrants from Cambodia (21.1%, a difference of 0.43%), and Pakistani (21.0%, a difference of 0.57%).
| Demographics | Rating | Rank | 3 or more Vehicles in Household |
| Laotians | 99.6 /100 | #85 | Exceptional 21.5% |
| Delaware | 99.6 /100 | #86 | Exceptional 21.5% |
| Immigrants | Azores | 99.5 /100 | #87 | Exceptional 21.5% |
| French | 99.4 /100 | #88 | Exceptional 21.4% |
| Marshallese | 99.2 /100 | #89 | Exceptional 21.3% |
| Immigrants | Afghanistan | 99.1 /100 | #90 | Exceptional 21.2% |
| Belgians | 98.9 /100 | #91 | Exceptional 21.2% |
| Apache | 98.9 /100 | #92 | Exceptional 21.2% |
| Immigrants | Indonesia | 98.8 /100 | #93 | Exceptional 21.1% |
| Immigrants | Cambodia | 98.6 /100 | #94 | Exceptional 21.1% |
| Pakistanis | 98.5 /100 | #95 | Exceptional 21.0% |
| Cree | 98.4 /100 | #96 | Exceptional 21.0% |
| Canadians | 98.3 /100 | #97 | Exceptional 21.0% |
| Hmong | 98.2 /100 | #98 | Exceptional 21.0% |
| Alaska Natives | 98.2 /100 | #99 | Exceptional 21.0% |