Belizean vs Immigrants from France 3 or more Vehicles in Household
COMPARE
Belizean
Immigrants from France
3 or more Vehicles in Household
3 or more Vehicles in Household Comparison
Belizeans
Immigrants from France
18.6%
3 OR MORE VEHICLES IN HOUSEHOLD
7.3/ 100
METRIC RATING
222nd/ 347
METRIC RANK
17.6%
3 OR MORE VEHICLES IN HOUSEHOLD
0.6/ 100
METRIC RATING
269th/ 347
METRIC RANK
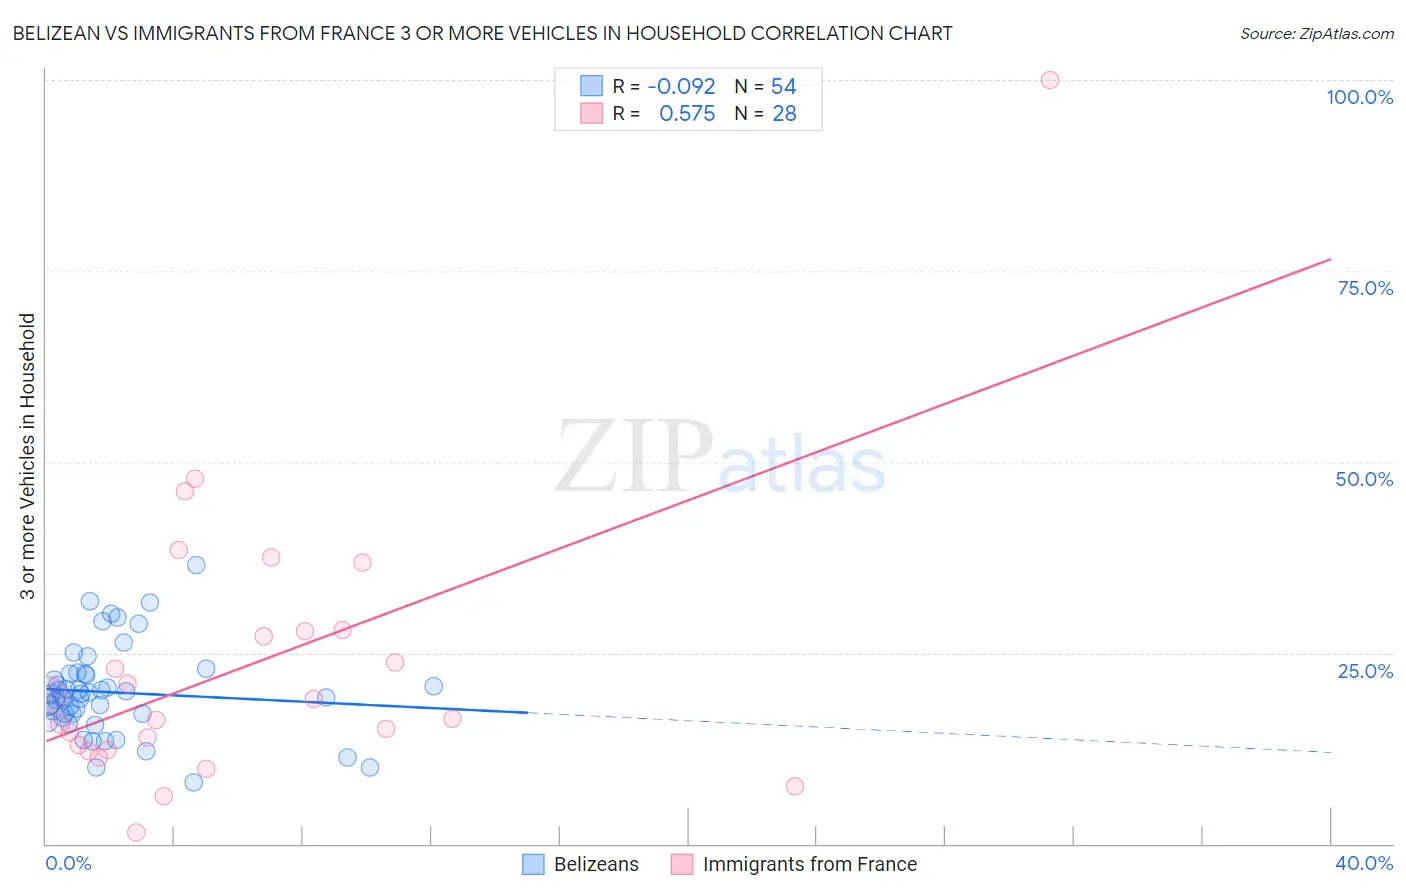
Belizean vs Immigrants from France 3 or more Vehicles in Household Correlation Chart
The statistical analysis conducted on geographies consisting of 144,156,890 people shows a slight negative correlation between the proportion of Belizeans and percentage of households with 3 or more vehicles available in the United States with a correlation coefficient (R) of -0.092 and weighted average of 18.6%. Similarly, the statistical analysis conducted on geographies consisting of 287,763,737 people shows a substantial positive correlation between the proportion of Immigrants from France and percentage of households with 3 or more vehicles available in the United States with a correlation coefficient (R) of 0.575 and weighted average of 17.6%, a difference of 5.3%.
3 or more Vehicles in Household Correlation Summary
| Measurement | Belizean | Immigrants from France |
| Minimum | 8.0% | 1.5% |
| Maximum | 36.6% | 100.0% |
| Range | 28.6% | 98.5% |
| Mean | 19.8% | 23.6% |
| Median | 19.4% | 17.7% |
| Interquartile 25% (IQ1) | 17.0% | 12.6% |
| Interquartile 75% (IQ3) | 22.2% | 27.9% |
| Interquartile Range (IQR) | 5.2% | 15.4% |
| Standard Deviation (Sample) | 5.8% | 19.1% |
| Standard Deviation (Population) | 5.8% | 18.7% |
Similar Demographics by 3 or more Vehicles in Household
Demographics Similar to Belizeans by 3 or more Vehicles in Household
In terms of 3 or more vehicles in household, the demographic groups most similar to Belizeans are Immigrants from Poland (18.6%, a difference of 0.050%), Nigerian (18.6%, a difference of 0.15%), Immigrants from Armenia (18.6%, a difference of 0.34%), Immigrants from Portugal (18.6%, a difference of 0.43%), and Immigrants from Czechoslovakia (18.5%, a difference of 0.47%).
| Demographics | Rating | Rank | 3 or more Vehicles in Household |
| Eastern Europeans | 10.6 /100 | #215 | Poor 18.7% |
| Immigrants | Nigeria | 10.3 /100 | #216 | Poor 18.7% |
| Immigrants | Italy | 10.2 /100 | #217 | Poor 18.7% |
| Immigrants | Portugal | 8.9 /100 | #218 | Tragic 18.6% |
| Immigrants | Armenia | 8.6 /100 | #219 | Tragic 18.6% |
| Nigerians | 7.9 /100 | #220 | Tragic 18.6% |
| Immigrants | Poland | 7.5 /100 | #221 | Tragic 18.6% |
| Belizeans | 7.3 /100 | #222 | Tragic 18.6% |
| Immigrants | Czechoslovakia | 5.9 /100 | #223 | Tragic 18.5% |
| Immigrants | Argentina | 5.6 /100 | #224 | Tragic 18.5% |
| Immigrants | Lithuania | 5.6 /100 | #225 | Tragic 18.5% |
| Immigrants | Hungary | 5.5 /100 | #226 | Tragic 18.5% |
| Immigrants | Singapore | 5.4 /100 | #227 | Tragic 18.4% |
| Turks | 5.4 /100 | #228 | Tragic 18.4% |
| Immigrants | Switzerland | 5.0 /100 | #229 | Tragic 18.4% |
Demographics Similar to Immigrants from France by 3 or more Vehicles in Household
In terms of 3 or more vehicles in household, the demographic groups most similar to Immigrants from France are Immigrants from Nepal (17.6%, a difference of 0.050%), South American (17.6%, a difference of 0.050%), Immigrants from Bulgaria (17.7%, a difference of 0.42%), Immigrants from Venezuela (17.7%, a difference of 0.44%), and Immigrants from Africa (17.6%, a difference of 0.46%).
| Demographics | Rating | Rank | 3 or more Vehicles in Household |
| Colombians | 0.9 /100 | #262 | Tragic 17.8% |
| Bermudans | 0.9 /100 | #263 | Tragic 17.8% |
| Cambodians | 0.9 /100 | #264 | Tragic 17.8% |
| Immigrants | Panama | 0.8 /100 | #265 | Tragic 17.7% |
| Macedonians | 0.8 /100 | #266 | Tragic 17.7% |
| Immigrants | Venezuela | 0.8 /100 | #267 | Tragic 17.7% |
| Immigrants | Bulgaria | 0.8 /100 | #268 | Tragic 17.7% |
| Immigrants | France | 0.6 /100 | #269 | Tragic 17.6% |
| Immigrants | Nepal | 0.6 /100 | #270 | Tragic 17.6% |
| South Americans | 0.6 /100 | #271 | Tragic 17.6% |
| Immigrants | Africa | 0.5 /100 | #272 | Tragic 17.6% |
| Immigrants | Sudan | 0.5 /100 | #273 | Tragic 17.6% |
| Immigrants | Bosnia and Herzegovina | 0.5 /100 | #274 | Tragic 17.5% |
| Immigrants | Ukraine | 0.4 /100 | #275 | Tragic 17.5% |
| Okinawans | 0.4 /100 | #276 | Tragic 17.4% |