Mongolian vs Bangladeshi 3 or more Vehicles in Household
COMPARE
Mongolian
Bangladeshi
3 or more Vehicles in Household
3 or more Vehicles in Household Comparison
Mongolians
Bangladeshis
18.1%
3 OR MORE VEHICLES IN HOUSEHOLD
2.3/ 100
METRIC RATING
244th/ 347
METRIC RANK
21.9%
3 OR MORE VEHICLES IN HOUSEHOLD
99.8/ 100
METRIC RATING
70th/ 347
METRIC RANK
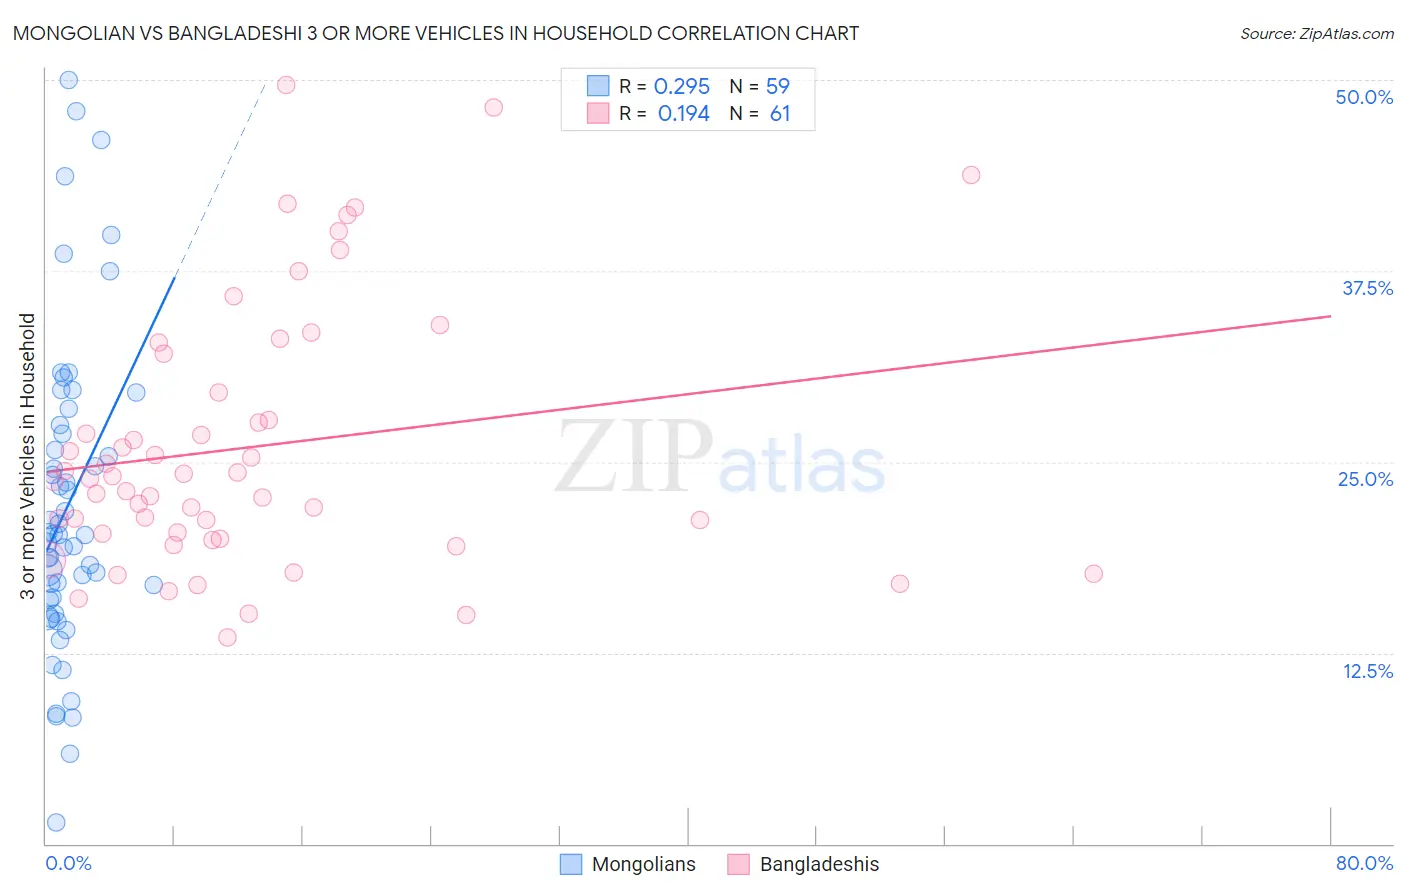
Mongolian vs Bangladeshi 3 or more Vehicles in Household Correlation Chart
The statistical analysis conducted on geographies consisting of 140,244,475 people shows a weak positive correlation between the proportion of Mongolians and percentage of households with 3 or more vehicles available in the United States with a correlation coefficient (R) of 0.295 and weighted average of 18.1%. Similarly, the statistical analysis conducted on geographies consisting of 141,336,310 people shows a poor positive correlation between the proportion of Bangladeshis and percentage of households with 3 or more vehicles available in the United States with a correlation coefficient (R) of 0.194 and weighted average of 21.9%, a difference of 20.7%.
3 or more Vehicles in Household Correlation Summary
| Measurement | Mongolian | Bangladeshi |
| Minimum | 1.4% | 13.5% |
| Maximum | 50.0% | 49.7% |
| Range | 48.6% | 36.1% |
| Mean | 22.2% | 26.0% |
| Median | 20.2% | 23.9% |
| Interquartile 25% (IQ1) | 15.9% | 20.1% |
| Interquartile 75% (IQ3) | 27.4% | 30.8% |
| Interquartile Range (IQR) | 11.5% | 10.7% |
| Standard Deviation (Sample) | 10.3% | 8.6% |
| Standard Deviation (Population) | 10.2% | 8.5% |
Similar Demographics by 3 or more Vehicles in Household
Demographics Similar to Mongolians by 3 or more Vehicles in Household
In terms of 3 or more vehicles in household, the demographic groups most similar to Mongolians are Immigrants from Europe (18.1%, a difference of 0.12%), Immigrants from Belize (18.1%, a difference of 0.16%), Immigrants from Australia (18.1%, a difference of 0.23%), Hopi (18.2%, a difference of 0.24%), and African (18.2%, a difference of 0.35%).
| Demographics | Rating | Rank | 3 or more Vehicles in Household |
| Indonesians | 3.5 /100 | #237 | Tragic 18.3% |
| Immigrants | Honduras | 3.1 /100 | #238 | Tragic 18.2% |
| Immigrants | Middle Africa | 3.1 /100 | #239 | Tragic 18.2% |
| Immigrants | China | 2.9 /100 | #240 | Tragic 18.2% |
| Africans | 2.7 /100 | #241 | Tragic 18.2% |
| Hopi | 2.5 /100 | #242 | Tragic 18.2% |
| Immigrants | Europe | 2.4 /100 | #243 | Tragic 18.1% |
| Mongolians | 2.3 /100 | #244 | Tragic 18.1% |
| Immigrants | Belize | 2.1 /100 | #245 | Tragic 18.1% |
| Immigrants | Australia | 2.0 /100 | #246 | Tragic 18.1% |
| Carpatho Rusyns | 1.9 /100 | #247 | Tragic 18.0% |
| Immigrants | Eastern Africa | 1.8 /100 | #248 | Tragic 18.0% |
| Immigrants | Saudi Arabia | 1.7 /100 | #249 | Tragic 18.0% |
| Venezuelans | 1.7 /100 | #250 | Tragic 18.0% |
| Alsatians | 1.5 /100 | #251 | Tragic 18.0% |
Demographics Similar to Bangladeshis by 3 or more Vehicles in Household
In terms of 3 or more vehicles in household, the demographic groups most similar to Bangladeshis are Potawatomi (21.9%, a difference of 0.010%), Creek (21.9%, a difference of 0.19%), Portuguese (21.8%, a difference of 0.19%), British (21.9%, a difference of 0.22%), and Salvadoran (21.8%, a difference of 0.28%).
| Demographics | Rating | Rank | 3 or more Vehicles in Household |
| Chickasaw | 99.9 /100 | #63 | Exceptional 22.2% |
| Immigrants | Taiwan | 99.9 /100 | #64 | Exceptional 22.1% |
| Pima | 99.9 /100 | #65 | Exceptional 22.0% |
| Northern Europeans | 99.9 /100 | #66 | Exceptional 22.0% |
| Alaskan Athabascans | 99.9 /100 | #67 | Exceptional 21.9% |
| British | 99.9 /100 | #68 | Exceptional 21.9% |
| Creek | 99.9 /100 | #69 | Exceptional 21.9% |
| Bangladeshis | 99.8 /100 | #70 | Exceptional 21.9% |
| Potawatomi | 99.8 /100 | #71 | Exceptional 21.9% |
| Portuguese | 99.8 /100 | #72 | Exceptional 21.8% |
| Salvadorans | 99.8 /100 | #73 | Exceptional 21.8% |
| Immigrants | Oceania | 99.8 /100 | #74 | Exceptional 21.8% |
| Japanese | 99.8 /100 | #75 | Exceptional 21.8% |
| Immigrants | Nonimmigrants | 99.8 /100 | #76 | Exceptional 21.8% |
| Irish | 99.8 /100 | #77 | Exceptional 21.8% |