Belizean vs Immigrants from Ghana 3 or more Vehicles in Household
COMPARE
Belizean
Immigrants from Ghana
3 or more Vehicles in Household
3 or more Vehicles in Household Comparison
Belizeans
Immigrants from Ghana
18.6%
3 OR MORE VEHICLES IN HOUSEHOLD
7.3/ 100
METRIC RATING
222nd/ 347
METRIC RANK
16.2%
3 OR MORE VEHICLES IN HOUSEHOLD
0.0/ 100
METRIC RATING
307th/ 347
METRIC RANK
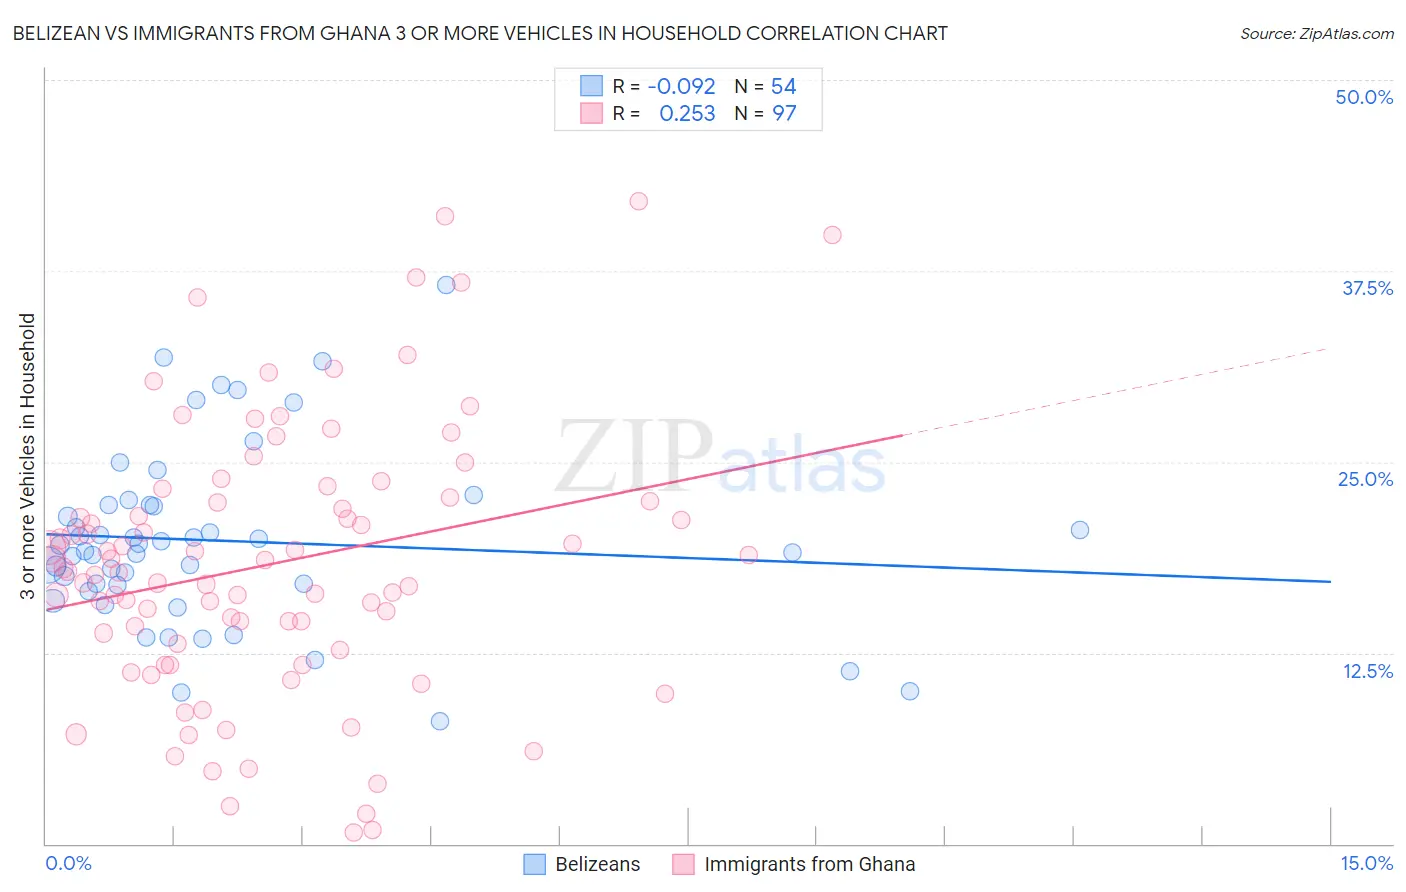
Belizean vs Immigrants from Ghana 3 or more Vehicles in Household Correlation Chart
The statistical analysis conducted on geographies consisting of 144,156,890 people shows a slight negative correlation between the proportion of Belizeans and percentage of households with 3 or more vehicles available in the United States with a correlation coefficient (R) of -0.092 and weighted average of 18.6%. Similarly, the statistical analysis conducted on geographies consisting of 199,771,460 people shows a weak positive correlation between the proportion of Immigrants from Ghana and percentage of households with 3 or more vehicles available in the United States with a correlation coefficient (R) of 0.253 and weighted average of 16.2%, a difference of 14.9%.
3 or more Vehicles in Household Correlation Summary
| Measurement | Belizean | Immigrants from Ghana |
| Minimum | 8.0% | 0.70% |
| Maximum | 36.6% | 42.0% |
| Range | 28.6% | 41.3% |
| Mean | 19.8% | 18.3% |
| Median | 19.4% | 17.8% |
| Interquartile 25% (IQ1) | 17.0% | 12.9% |
| Interquartile 75% (IQ3) | 22.2% | 22.6% |
| Interquartile Range (IQR) | 5.2% | 9.7% |
| Standard Deviation (Sample) | 5.8% | 8.8% |
| Standard Deviation (Population) | 5.8% | 8.8% |
Similar Demographics by 3 or more Vehicles in Household
Demographics Similar to Belizeans by 3 or more Vehicles in Household
In terms of 3 or more vehicles in household, the demographic groups most similar to Belizeans are Immigrants from Poland (18.6%, a difference of 0.050%), Nigerian (18.6%, a difference of 0.15%), Immigrants from Armenia (18.6%, a difference of 0.34%), Immigrants from Portugal (18.6%, a difference of 0.43%), and Immigrants from Czechoslovakia (18.5%, a difference of 0.47%).
| Demographics | Rating | Rank | 3 or more Vehicles in Household |
| Eastern Europeans | 10.6 /100 | #215 | Poor 18.7% |
| Immigrants | Nigeria | 10.3 /100 | #216 | Poor 18.7% |
| Immigrants | Italy | 10.2 /100 | #217 | Poor 18.7% |
| Immigrants | Portugal | 8.9 /100 | #218 | Tragic 18.6% |
| Immigrants | Armenia | 8.6 /100 | #219 | Tragic 18.6% |
| Nigerians | 7.9 /100 | #220 | Tragic 18.6% |
| Immigrants | Poland | 7.5 /100 | #221 | Tragic 18.6% |
| Belizeans | 7.3 /100 | #222 | Tragic 18.6% |
| Immigrants | Czechoslovakia | 5.9 /100 | #223 | Tragic 18.5% |
| Immigrants | Argentina | 5.6 /100 | #224 | Tragic 18.5% |
| Immigrants | Lithuania | 5.6 /100 | #225 | Tragic 18.5% |
| Immigrants | Hungary | 5.5 /100 | #226 | Tragic 18.5% |
| Immigrants | Singapore | 5.4 /100 | #227 | Tragic 18.4% |
| Turks | 5.4 /100 | #228 | Tragic 18.4% |
| Immigrants | Switzerland | 5.0 /100 | #229 | Tragic 18.4% |
Demographics Similar to Immigrants from Ghana by 3 or more Vehicles in Household
In terms of 3 or more vehicles in household, the demographic groups most similar to Immigrants from Ghana are Somali (16.2%, a difference of 0.15%), Houma (16.1%, a difference of 0.59%), Immigrants from Morocco (16.3%, a difference of 0.96%), Ghanaian (16.4%, a difference of 1.2%), and Immigrants from Somalia (15.9%, a difference of 1.5%).
| Demographics | Rating | Rank | 3 or more Vehicles in Household |
| Cypriots | 0.0 /100 | #300 | Tragic 16.6% |
| Paraguayans | 0.0 /100 | #301 | Tragic 16.6% |
| Immigrants | Greece | 0.0 /100 | #302 | Tragic 16.5% |
| Immigrants | Serbia | 0.0 /100 | #303 | Tragic 16.4% |
| Ghanaians | 0.0 /100 | #304 | Tragic 16.4% |
| Immigrants | Morocco | 0.0 /100 | #305 | Tragic 16.3% |
| Somalis | 0.0 /100 | #306 | Tragic 16.2% |
| Immigrants | Ghana | 0.0 /100 | #307 | Tragic 16.2% |
| Houma | 0.0 /100 | #308 | Tragic 16.1% |
| Immigrants | Somalia | 0.0 /100 | #309 | Tragic 15.9% |
| Moroccans | 0.0 /100 | #310 | Tragic 15.9% |
| Albanians | 0.0 /100 | #311 | Tragic 15.8% |
| Puerto Ricans | 0.0 /100 | #312 | Tragic 15.6% |
| Immigrants | Israel | 0.0 /100 | #313 | Tragic 15.6% |
| Immigrants | Belarus | 0.0 /100 | #314 | Tragic 15.5% |