Belizean vs Croatian 3 or more Vehicles in Household
COMPARE
Belizean
Croatian
3 or more Vehicles in Household
3 or more Vehicles in Household Comparison
Belizeans
Croatians
18.6%
3 OR MORE VEHICLES IN HOUSEHOLD
7.3/ 100
METRIC RATING
222nd/ 347
METRIC RANK
20.6%
3 OR MORE VEHICLES IN HOUSEHOLD
94.9/ 100
METRIC RATING
117th/ 347
METRIC RANK
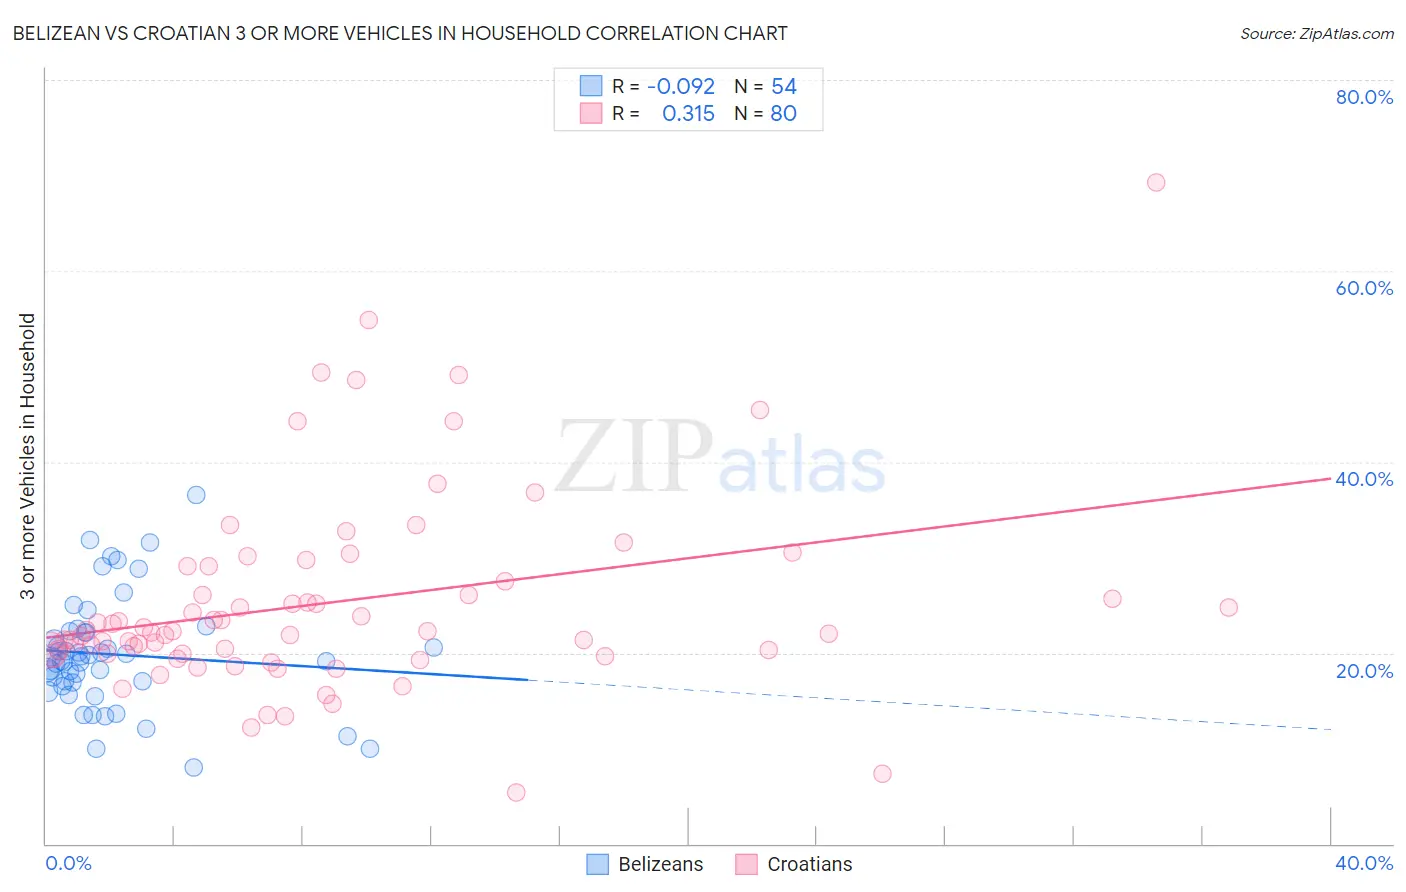
Belizean vs Croatian 3 or more Vehicles in Household Correlation Chart
The statistical analysis conducted on geographies consisting of 144,156,890 people shows a slight negative correlation between the proportion of Belizeans and percentage of households with 3 or more vehicles available in the United States with a correlation coefficient (R) of -0.092 and weighted average of 18.6%. Similarly, the statistical analysis conducted on geographies consisting of 375,444,957 people shows a mild positive correlation between the proportion of Croatians and percentage of households with 3 or more vehicles available in the United States with a correlation coefficient (R) of 0.315 and weighted average of 20.6%, a difference of 10.8%.
3 or more Vehicles in Household Correlation Summary
| Measurement | Belizean | Croatian |
| Minimum | 8.0% | 5.4% |
| Maximum | 36.6% | 69.3% |
| Range | 28.6% | 63.8% |
| Mean | 19.8% | 25.2% |
| Median | 19.4% | 22.2% |
| Interquartile 25% (IQ1) | 17.0% | 19.9% |
| Interquartile 75% (IQ3) | 22.2% | 28.3% |
| Interquartile Range (IQR) | 5.2% | 8.4% |
| Standard Deviation (Sample) | 5.8% | 10.5% |
| Standard Deviation (Population) | 5.8% | 10.4% |
Similar Demographics by 3 or more Vehicles in Household
Demographics Similar to Belizeans by 3 or more Vehicles in Household
In terms of 3 or more vehicles in household, the demographic groups most similar to Belizeans are Immigrants from Poland (18.6%, a difference of 0.050%), Nigerian (18.6%, a difference of 0.15%), Immigrants from Armenia (18.6%, a difference of 0.34%), Immigrants from Portugal (18.6%, a difference of 0.43%), and Immigrants from Czechoslovakia (18.5%, a difference of 0.47%).
| Demographics | Rating | Rank | 3 or more Vehicles in Household |
| Eastern Europeans | 10.6 /100 | #215 | Poor 18.7% |
| Immigrants | Nigeria | 10.3 /100 | #216 | Poor 18.7% |
| Immigrants | Italy | 10.2 /100 | #217 | Poor 18.7% |
| Immigrants | Portugal | 8.9 /100 | #218 | Tragic 18.6% |
| Immigrants | Armenia | 8.6 /100 | #219 | Tragic 18.6% |
| Nigerians | 7.9 /100 | #220 | Tragic 18.6% |
| Immigrants | Poland | 7.5 /100 | #221 | Tragic 18.6% |
| Belizeans | 7.3 /100 | #222 | Tragic 18.6% |
| Immigrants | Czechoslovakia | 5.9 /100 | #223 | Tragic 18.5% |
| Immigrants | Argentina | 5.6 /100 | #224 | Tragic 18.5% |
| Immigrants | Lithuania | 5.6 /100 | #225 | Tragic 18.5% |
| Immigrants | Hungary | 5.5 /100 | #226 | Tragic 18.5% |
| Immigrants | Singapore | 5.4 /100 | #227 | Tragic 18.4% |
| Turks | 5.4 /100 | #228 | Tragic 18.4% |
| Immigrants | Switzerland | 5.0 /100 | #229 | Tragic 18.4% |
Demographics Similar to Croatians by 3 or more Vehicles in Household
In terms of 3 or more vehicles in household, the demographic groups most similar to Croatians are Italian (20.6%, a difference of 0.020%), French Canadian (20.6%, a difference of 0.050%), Costa Rican (20.6%, a difference of 0.11%), Immigrants from Latin America (20.5%, a difference of 0.15%), and Maltese (20.5%, a difference of 0.35%).
| Demographics | Rating | Rank | 3 or more Vehicles in Household |
| Asians | 96.8 /100 | #110 | Exceptional 20.8% |
| Immigrants | Micronesia | 96.7 /100 | #111 | Exceptional 20.7% |
| Nicaraguans | 96.2 /100 | #112 | Exceptional 20.7% |
| Immigrants | England | 96.2 /100 | #113 | Exceptional 20.7% |
| Burmese | 95.8 /100 | #114 | Exceptional 20.6% |
| French Canadians | 95.0 /100 | #115 | Exceptional 20.6% |
| Italians | 94.9 /100 | #116 | Exceptional 20.6% |
| Croatians | 94.9 /100 | #117 | Exceptional 20.6% |
| Costa Ricans | 94.6 /100 | #118 | Exceptional 20.6% |
| Immigrants | Latin America | 94.5 /100 | #119 | Exceptional 20.5% |
| Maltese | 93.9 /100 | #120 | Exceptional 20.5% |
| Immigrants | Thailand | 93.8 /100 | #121 | Exceptional 20.5% |
| German Russians | 93.7 /100 | #122 | Exceptional 20.5% |
| Immigrants | Korea | 93.7 /100 | #123 | Exceptional 20.5% |
| Central Americans | 93.1 /100 | #124 | Exceptional 20.5% |