Immigrants from Indonesia vs Bangladeshi 3 or more Vehicles in Household

COMPARE

Immigrants from Indonesia
Race
Ancestry
AfghanAfricanAlaska NativeAlaskan AthabascanAlbanianAleutAlsatianAmericanApacheArabArapahoArgentineanArmenianAssyrian/Chaldean/SyriacAustralianAustrianBahamianBarbadianBasqueBelgianBelizeanBermudanBhutaneseBlackfeetBolivianBrazilianBritishBritish West IndianBulgarianBurmeseCajunCambodianCanadianCape VerdeanCarpatho RusynCelticCentral AmericanCentral American IndianCherokeeCheyenneChickasawChileanChineseChippewaChoctawColombianColvilleComancheCosta RicanCreeCreekCroatianCrowCubanCypriotCzechCzechoslovakianDanishDelawareDominicanDutchDutch West IndianEastern EuropeanEcuadorianEgyptianEnglishEstonianEthiopianEuropeanFijianFilipinoFinnishFrenchFrench American IndianFrench CanadianGermanGerman RussianGhanaianGreekGuamanian/ChamorroGuatemalanGuyaneseHaitianHmongHonduranHopiHoumaHungarianIcelanderIndian (Asian)IndonesianInupiatIranianIraqiIrishIroquoisIsraeliItalianJamaicanJapaneseJordanianKenyanKiowaKoreanLaotianLatvianLebaneseLiberianLithuanianLumbeeLuxembourgerMacedonianMalaysianMalteseMarshalleseMenomineeMexicanMexican American IndianMongolianMoroccanNative HawaiianNavajoNepaleseNew ZealanderNicaraguanNigerianNorthern EuropeanNorwegianOkinawanOsageOttawaPaiutePakistaniPalestinianPanamanianParaguayanPennsylvania GermanPeruvianPimaPolishPortuguesePotawatomiPuebloPuerto RicanPuget Sound SalishRomanianRussianSalvadoranSamoanScandinavianScotch-IrishScottishSeminoleSenegaleseSerbianShoshoneSierra LeoneanSiouxSlavicSlovakSloveneSomaliSouth AfricanSouth AmericanSouth American IndianSoviet UnionSpaniardSpanishSpanish AmericanSpanish American IndianSri LankanSubsaharan AfricanSudaneseSwedishSwissSyrianTaiwaneseThaiTlingit-HaidaTohono O'OdhamTonganTrinidadian and TobagonianTsimshianTurkishU.S. Virgin IslanderUgandanUkrainianUruguayanUteVenezuelanVietnameseWelshWest IndianYakamaYaquiYugoslavianYumanYup'ikZimbabwean
Immigration
NonimmigrantsImmigrantsAfghanistanAfricaAlbaniaArgentinaArmeniaAsiaAustraliaAustriaBahamasBangladeshBarbadosBelarusBelgiumBelizeBoliviaBosnia and HerzegovinaBrazilBulgariaBurma/MyanmarCabo VerdeCambodiaCameroonCanadaCaribbeanCentral AmericaChileChinaColombiaCongoCosta RicaCroatiaCubaCzechoslovakiaDenmarkDominicaDominican RepublicEastern AfricaEastern AsiaEastern EuropeEcuadorEgyptEl SalvadorEnglandEritreaEthiopiaEuropeFijiFranceGermanyGhanaGreeceGrenadaGuatemalaGuyanaHaitiHondurasHong KongHungaryIndiaIndonesiaIranIraqIrelandIsraelItalyJamaicaJapanJordanKazakhstanKenyaKoreaKuwaitLaosLatin AmericaLatviaLebanonLiberiaLithuaniaMalaysiaMexicoMicronesiaMiddle AfricaMoldovaMoroccoNepalNetherlandsNicaraguaNigeriaNorth AmericaNorth MacedoniaNorthern AfricaNorthern EuropeNorwayOceaniaPakistanPanamaPeruPhilippinesPolandPortugalRomaniaRussiaSaudi ArabiaScotlandSenegalSerbiaSierra LeoneSingaporeSomaliaSouth AfricaSouth AmericaSouth Central AsiaSouth Eastern AsiaSouthern EuropeSpainSri LankaSt. Vincent and the GrenadinesSudanSwedenSwitzerlandSyriaTaiwanThailandTrinidad and TobagoTurkeyUgandaUkraineUruguayUzbekistanVenezuelaVietnamWest IndiesWestern AfricaWestern AsiaWestern EuropeYemenZaireZimbabweAzores
Bangladeshi
Race
Ancestry
AfghanAfricanAlaska NativeAlaskan AthabascanAlbanianAleutAlsatianAmericanApacheArabArapahoArgentineanArmenianAssyrian/Chaldean/SyriacAustralianAustrianBahamianBangladeshiBarbadianBasqueBelgianBelizeanBermudanBhutaneseBlackfeetBolivianBrazilianBritishBritish West IndianBulgarianBurmeseCajunCambodianCanadianCape VerdeanCarpatho RusynCelticCentral AmericanCentral American IndianCherokeeCheyenneChickasawChileanChineseChippewaChoctawColombianColvilleComancheCosta RicanCreeCreekCroatianCrowCubanCypriotCzechCzechoslovakianDanishDelawareDominicanDutchDutch West IndianEastern EuropeanEcuadorianEgyptianEnglishEstonianEthiopianEuropeanFijianFilipinoFinnishFrenchFrench American IndianFrench CanadianGermanGerman RussianGhanaianGreekGuamanian/ChamorroGuatemalanGuyaneseHaitianHmongHonduranHopiHoumaHungarianIcelanderIndian (Asian)IndonesianInupiatIranianIraqiIrishIroquoisIsraeliItalianJamaicanJapaneseJordanianKenyanKiowaKoreanLaotianLatvianLebaneseLiberianLithuanianLumbeeLuxembourgerMacedonianMalaysianMalteseMarshalleseMenomineeMexicanMexican American IndianMongolianMoroccanNative HawaiianNavajoNepaleseNew ZealanderNicaraguanNigerianNorthern EuropeanNorwegianOkinawanOsageOttawaPaiutePakistaniPalestinianPanamanianParaguayanPennsylvania GermanPeruvianPimaPolishPortuguesePotawatomiPuebloPuerto RicanPuget Sound SalishRomanianRussianSalvadoranSamoanScandinavianScotch-IrishScottishSeminoleSenegaleseSerbianShoshoneSierra LeoneanSiouxSlavicSlovakSloveneSomaliSouth AfricanSouth AmericanSouth American IndianSoviet UnionSpaniardSpanishSpanish AmericanSpanish American IndianSri LankanSubsaharan AfricanSudaneseSwedishSwissSyrianTaiwaneseThaiTlingit-HaidaTohono O'OdhamTonganTrinidadian and TobagonianTsimshianTurkishU.S. Virgin IslanderUgandanUkrainianUruguayanUteVenezuelanVietnameseWelshWest IndianYakamaYaquiYugoslavianYumanYup'ikZimbabwean
Immigration
NonimmigrantsImmigrantsAfghanistanAfricaAlbaniaArgentinaArmeniaAsiaAustraliaAustriaBahamasBangladeshBarbadosBelarusBelgiumBelizeBoliviaBosnia and HerzegovinaBrazilBulgariaBurma/MyanmarCabo VerdeCambodiaCameroonCanadaCaribbeanCentral AmericaChileChinaColombiaCongoCosta RicaCroatiaCubaCzechoslovakiaDenmarkDominicaDominican RepublicEastern AfricaEastern AsiaEastern EuropeEcuadorEgyptEl SalvadorEnglandEritreaEthiopiaEuropeFijiFranceGermanyGhanaGreeceGrenadaGuatemalaGuyanaHaitiHondurasHong KongHungaryIndiaIranIraqIrelandIsraelItalyJamaicaJapanJordanKazakhstanKenyaKoreaKuwaitLaosLatin AmericaLatviaLebanonLiberiaLithuaniaMalaysiaMexicoMicronesiaMiddle AfricaMoldovaMoroccoNepalNetherlandsNicaraguaNigeriaNorth AmericaNorth MacedoniaNorthern AfricaNorthern EuropeNorwayOceaniaPakistanPanamaPeruPhilippinesPolandPortugalRomaniaRussiaSaudi ArabiaScotlandSenegalSerbiaSierra LeoneSingaporeSomaliaSouth AfricaSouth AmericaSouth Central AsiaSouth Eastern AsiaSouthern EuropeSpainSri LankaSt. Vincent and the GrenadinesSudanSwedenSwitzerlandSyriaTaiwanThailandTrinidad and TobagoTurkeyUgandaUkraineUruguayUzbekistanVenezuelaVietnamWest IndiesWestern AfricaWestern AsiaWestern EuropeYemenZaireZimbabweAzores
3 or more Vehicles in Household
Income
Poverty
Unemployment
Labor Participation
Family Structure
Vehicle Availability
Education Level
Disability

3 or more Vehicles in Household Comparison

Immigrants from Indonesia

Bangladeshis

Exceptional
Exceptional
21.1%
3 OR MORE VEHICLES IN HOUSEHOLD
98.8/ 100
METRIC RATING
93rd/ 347
METRIC RANK
21.9%
3 OR MORE VEHICLES IN HOUSEHOLD
99.8/ 100
METRIC RATING
70th/ 347
METRIC RANK

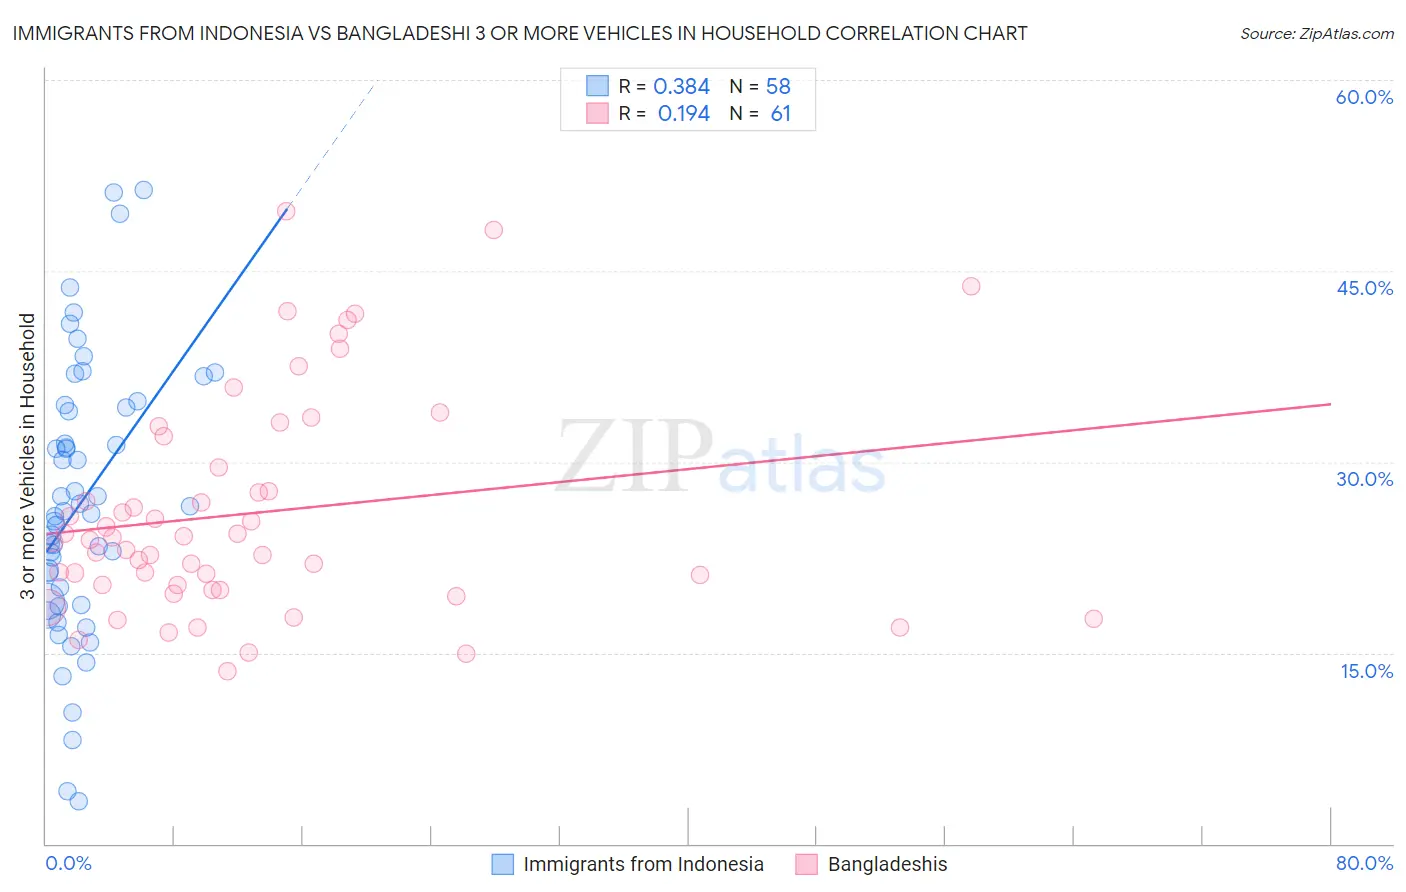
Immigrants from Indonesia vs Bangladeshi 3 or more Vehicles in Household Correlation Chart

The statistical analysis conducted on geographies consisting of 215,673,146 people shows a mild positive correlation between the proportion of Immigrants from Indonesia and percentage of households with 3 or more vehicles available in the United States with a correlation coefficient (R) of 0.384 and weighted average of 21.1%. Similarly, the statistical analysis conducted on geographies consisting of 141,336,310 people shows a poor positive correlation between the proportion of Bangladeshis and percentage of households with 3 or more vehicles available in the United States with a correlation coefficient (R) of 0.194 and weighted average of 21.9%, a difference of 3.6%.
Immigrants from Indonesia vs Bangladeshi 3 or more Vehicles in Household

3 or more Vehicles in Household Correlation Summary

MeasurementImmigrants from IndonesiaBangladeshi
Minimum3.3%13.5%
Maximum51.4%49.7%
Range48.1%36.1%
Mean26.9%26.0%
Median26.0%23.9%
Interquartile 25% (IQ1)19.0%20.1%
Interquartile 75% (IQ3)34.3%30.8%
Interquartile Range (IQR)15.3%10.7%
Standard Deviation (Sample)10.7%8.6%
Standard Deviation (Population)10.6%8.5%

Similar Demographics by 3 or more Vehicles in Household

Demographics Similar to Immigrants from Indonesia by 3 or more Vehicles in Household

In terms of 3 or more vehicles in household, the demographic groups most similar to Immigrants from Indonesia are Apache (21.2%, a difference of 0.20%), Immigrants from Cambodia (21.1%, a difference of 0.23%), Belgian (21.2%, a difference of 0.28%), Pakistani (21.0%, a difference of 0.37%), and Cree (21.0%, a difference of 0.46%).
DemographicsRating | Rank3 or more Vehicles in Household
Delaware
99.6
/100
|
#86
Exceptional
21.5%
Immigrants | Azores
99.5
/100
|
#87
Exceptional
21.5%
French
99.4
/100
|
#88
Exceptional
21.4%
Marshallese
99.2
/100
|
#89
Exceptional
21.3%
Immigrants | Afghanistan
99.1
/100
|
#90
Exceptional
21.2%
Belgians
98.9
/100
|
#91
Exceptional
21.2%
Apache
98.9
/100
|
#92
Exceptional
21.2%
Immigrants | Indonesia
98.8
/100
|
#93
Exceptional
21.1%
Immigrants | Cambodia
98.6
/100
|
#94
Exceptional
21.1%
Pakistanis
98.5
/100
|
#95
Exceptional
21.0%
Cree
98.4
/100
|
#96
Exceptional
21.0%
Canadians
98.3
/100
|
#97
Exceptional
21.0%
Hmong
98.2
/100
|
#98
Exceptional
21.0%
Alaska Natives
98.2
/100
|
#99
Exceptional
21.0%
Comanche
98.2
/100
|
#100
Exceptional
21.0%

Demographics Similar to Bangladeshis by 3 or more Vehicles in Household

In terms of 3 or more vehicles in household, the demographic groups most similar to Bangladeshis are Potawatomi (21.9%, a difference of 0.010%), Creek (21.9%, a difference of 0.19%), Portuguese (21.8%, a difference of 0.19%), British (21.9%, a difference of 0.22%), and Salvadoran (21.8%, a difference of 0.28%).
DemographicsRating | Rank3 or more Vehicles in Household
Chickasaw
99.9
/100
|
#63
Exceptional
22.2%
Immigrants | Taiwan
99.9
/100
|
#64
Exceptional
22.1%
Pima
99.9
/100
|
#65
Exceptional
22.0%
Northern Europeans
99.9
/100
|
#66
Exceptional
22.0%
Alaskan Athabascans
99.9
/100
|
#67
Exceptional
21.9%
British
99.9
/100
|
#68
Exceptional
21.9%
Creek
99.9
/100
|
#69
Exceptional
21.9%
Bangladeshis
99.8
/100
|
#70
Exceptional
21.9%
Potawatomi
99.8
/100
|
#71
Exceptional
21.9%
Portuguese
99.8
/100
|
#72
Exceptional
21.8%
Salvadorans
99.8
/100
|
#73
Exceptional
21.8%
Immigrants | Oceania
99.8
/100
|
#74
Exceptional
21.8%
Japanese
99.8
/100
|
#75
Exceptional
21.8%
Immigrants | Nonimmigrants
99.8
/100
|
#76
Exceptional
21.8%
Irish
99.8
/100
|
#77
Exceptional
21.8%