Alaska Native vs Cherokee 11th Grade
COMPARE
Alaska Native
Cherokee
11th Grade
11th Grade Comparison
Alaska Natives
Cherokee
93.5%
11TH GRADE
98.4/ 100
METRIC RATING
108th/ 347
METRIC RANK
92.4%
11TH GRADE
40.7/ 100
METRIC RATING
181st/ 347
METRIC RANK
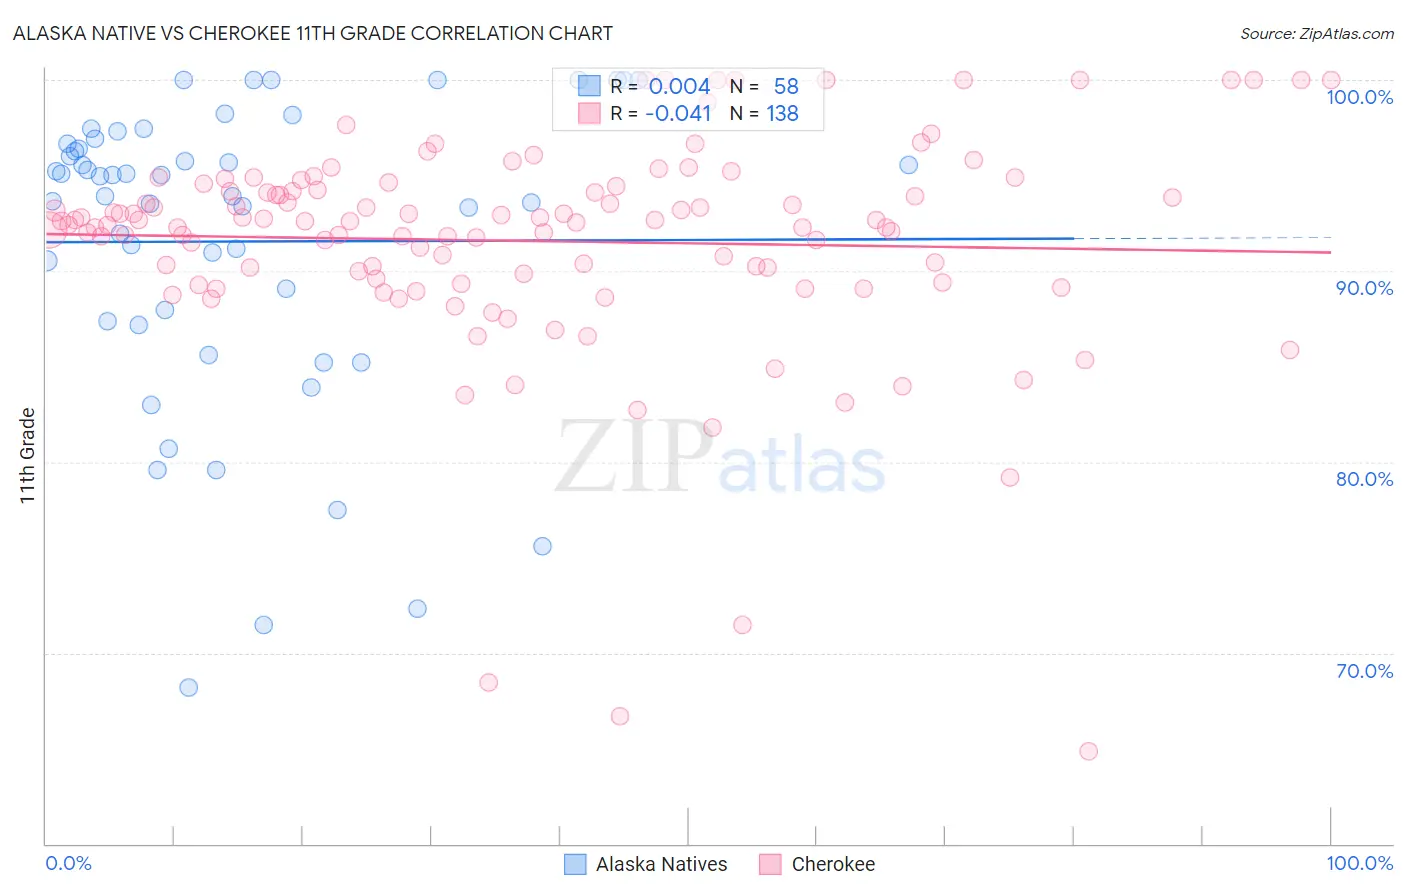
Alaska Native vs Cherokee 11th Grade Correlation Chart
The statistical analysis conducted on geographies consisting of 76,778,827 people shows no correlation between the proportion of Alaska Natives and percentage of population with at least 11th grade education in the United States with a correlation coefficient (R) of 0.004 and weighted average of 93.5%. Similarly, the statistical analysis conducted on geographies consisting of 493,720,047 people shows no correlation between the proportion of Cherokee and percentage of population with at least 11th grade education in the United States with a correlation coefficient (R) of -0.041 and weighted average of 92.4%, a difference of 1.1%.
11th Grade Correlation Summary
| Measurement | Alaska Native | Cherokee |
| Minimum | 68.2% | 64.9% |
| Maximum | 100.0% | 100.0% |
| Range | 31.8% | 35.1% |
| Mean | 91.5% | 91.6% |
| Median | 94.4% | 92.6% |
| Interquartile 25% (IQ1) | 87.4% | 89.6% |
| Interquartile 75% (IQ3) | 96.6% | 94.2% |
| Interquartile Range (IQR) | 9.3% | 4.6% |
| Standard Deviation (Sample) | 7.9% | 5.8% |
| Standard Deviation (Population) | 7.8% | 5.8% |
Similar Demographics by 11th Grade
Demographics Similar to Alaska Natives by 11th Grade
In terms of 11th grade, the demographic groups most similar to Alaska Natives are Immigrants from Norway (93.5%, a difference of 0.0%), Immigrants from Kuwait (93.5%, a difference of 0.0%), Syrian (93.4%, a difference of 0.010%), Immigrants from Europe (93.5%, a difference of 0.020%), and Immigrants from Serbia (93.5%, a difference of 0.020%).
| Demographics | Rating | Rank | 11th Grade |
| Immigrants | Romania | 98.7 /100 | #101 | Exceptional 93.5% |
| Chippewa | 98.6 /100 | #102 | Exceptional 93.5% |
| Lebanese | 98.6 /100 | #103 | Exceptional 93.5% |
| Immigrants | Europe | 98.6 /100 | #104 | Exceptional 93.5% |
| Immigrants | Serbia | 98.6 /100 | #105 | Exceptional 93.5% |
| Immigrants | Croatia | 98.6 /100 | #106 | Exceptional 93.5% |
| Immigrants | Norway | 98.4 /100 | #107 | Exceptional 93.5% |
| Alaska Natives | 98.4 /100 | #108 | Exceptional 93.5% |
| Immigrants | Kuwait | 98.4 /100 | #109 | Exceptional 93.5% |
| Syrians | 98.4 /100 | #110 | Exceptional 93.4% |
| Yugoslavians | 98.1 /100 | #111 | Exceptional 93.4% |
| Immigrants | Germany | 98.0 /100 | #112 | Exceptional 93.4% |
| Immigrants | Zimbabwe | 97.8 /100 | #113 | Exceptional 93.4% |
| Jordanians | 97.8 /100 | #114 | Exceptional 93.4% |
| Palestinians | 97.7 /100 | #115 | Exceptional 93.4% |
Demographics Similar to Cherokee by 11th Grade
In terms of 11th grade, the demographic groups most similar to Cherokee are Creek (92.4%, a difference of 0.0%), Inupiat (92.4%, a difference of 0.0%), Immigrants from Morocco (92.4%, a difference of 0.020%), Sudanese (92.5%, a difference of 0.030%), and Immigrants from Malaysia (92.4%, a difference of 0.030%).
| Demographics | Rating | Rank | 11th Grade |
| Asians | 50.0 /100 | #174 | Average 92.5% |
| Shoshone | 48.9 /100 | #175 | Average 92.5% |
| Spaniards | 46.9 /100 | #176 | Average 92.5% |
| Guamanians/Chamorros | 45.0 /100 | #177 | Average 92.5% |
| Sudanese | 43.4 /100 | #178 | Average 92.5% |
| Creek | 40.9 /100 | #179 | Average 92.4% |
| Inupiat | 40.7 /100 | #180 | Average 92.4% |
| Cherokee | 40.7 /100 | #181 | Average 92.4% |
| Immigrants | Morocco | 38.6 /100 | #182 | Fair 92.4% |
| Immigrants | Malaysia | 37.6 /100 | #183 | Fair 92.4% |
| Immigrants | Asia | 37.4 /100 | #184 | Fair 92.4% |
| Immigrants | Nepal | 36.4 /100 | #185 | Fair 92.4% |
| Arapaho | 35.1 /100 | #186 | Fair 92.4% |
| Immigrants | Western Asia | 35.0 /100 | #187 | Fair 92.4% |
| Immigrants | Indonesia | 33.7 /100 | #188 | Fair 92.4% |