Alaska Native vs Cherokee Disability Age Under 5
COMPARE
Alaska Native
Cherokee
Disability Age Under 5
Disability Age Under 5 Comparison
Alaska Natives
Cherokee
2.9%
DISABILITY AGE UNDER 5
0.0/ 100
METRIC RATING
342nd/ 347
METRIC RANK
1.8%
DISABILITY AGE UNDER 5
0.0/ 100
METRIC RATING
324th/ 347
METRIC RANK
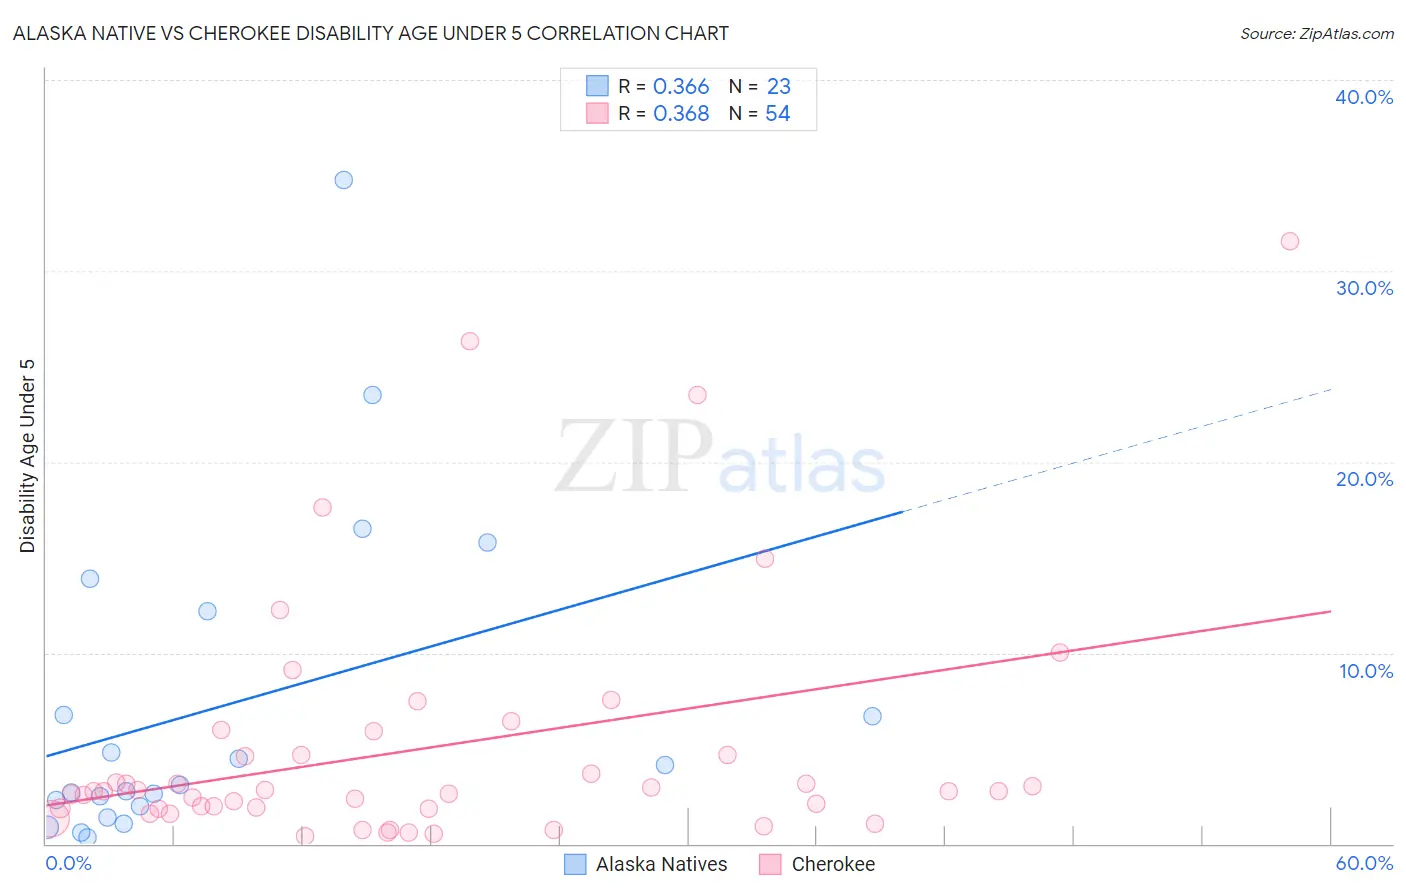
Alaska Native vs Cherokee Disability Age Under 5 Correlation Chart
The statistical analysis conducted on geographies consisting of 62,848,423 people shows a mild positive correlation between the proportion of Alaska Natives and percentage of population with a disability under the age of 5 in the United States with a correlation coefficient (R) of 0.366 and weighted average of 2.9%. Similarly, the statistical analysis conducted on geographies consisting of 245,498,601 people shows a mild positive correlation between the proportion of Cherokee and percentage of population with a disability under the age of 5 in the United States with a correlation coefficient (R) of 0.368 and weighted average of 1.8%, a difference of 66.1%.
Disability Age Under 5 Correlation Summary
| Measurement | Alaska Native | Cherokee |
| Minimum | 0.35% | 0.42% |
| Maximum | 34.8% | 31.6% |
| Range | 34.4% | 31.2% |
| Mean | 7.2% | 5.0% |
| Median | 3.1% | 2.8% |
| Interquartile 25% (IQ1) | 2.0% | 1.9% |
| Interquartile 75% (IQ3) | 12.2% | 4.7% |
| Interquartile Range (IQR) | 10.2% | 2.8% |
| Standard Deviation (Sample) | 8.6% | 6.5% |
| Standard Deviation (Population) | 8.4% | 6.4% |
Demographics Similar to Alaska Natives and Cherokee by Disability Age Under 5
In terms of disability age under 5, the demographic groups most similar to Alaska Natives are Colville (3.3%, a difference of 11.6%), Tsimshian (2.4%, a difference of 22.1%), Menominee (2.3%, a difference of 28.1%), Immigrants from the Azores (2.2%, a difference of 31.6%), and Tohono O'odham (2.2%, a difference of 34.5%). Similarly, the demographic groups most similar to Cherokee are Immigrants from Portugal (1.8%, a difference of 1.3%), Chickasaw (1.7%, a difference of 1.8%), Sioux (1.8%, a difference of 2.8%), Osage (1.8%, a difference of 3.2%), and American (1.9%, a difference of 4.9%).
| Demographics | Rating | Rank | Disability Age Under 5 |
| Chickasaw | 0.0 /100 | #323 | Tragic 1.7% |
| Cherokee | 0.0 /100 | #324 | Tragic 1.8% |
| Immigrants | Portugal | 0.0 /100 | #325 | Tragic 1.8% |
| Sioux | 0.0 /100 | #326 | Tragic 1.8% |
| Osage | 0.0 /100 | #327 | Tragic 1.8% |
| Americans | 0.0 /100 | #328 | Tragic 1.9% |
| Houma | 0.0 /100 | #329 | Tragic 1.9% |
| Choctaw | 0.0 /100 | #330 | Tragic 1.9% |
| French Canadians | 0.0 /100 | #331 | Tragic 1.9% |
| Chippewa | 0.0 /100 | #332 | Tragic 1.9% |
| Dutch West Indians | 0.0 /100 | #333 | Tragic 1.9% |
| Natives/Alaskans | 0.0 /100 | #334 | Tragic 1.9% |
| Pennsylvania Germans | 0.0 /100 | #335 | Tragic 1.9% |
| Paraguayans | 0.0 /100 | #336 | Tragic 2.0% |
| Apache | 0.0 /100 | #337 | Tragic 2.0% |
| Tohono O'odham | 0.0 /100 | #338 | Tragic 2.2% |
| Immigrants | Azores | 0.0 /100 | #339 | Tragic 2.2% |
| Menominee | 0.0 /100 | #340 | Tragic 2.3% |
| Tsimshian | 0.0 /100 | #341 | Tragic 2.4% |
| Alaska Natives | 0.0 /100 | #342 | Tragic 2.9% |
| Colville | 0.0 /100 | #343 | Tragic 3.3% |