Alaska Native vs Cherokee 4th Grade
COMPARE
Alaska Native
Cherokee
4th Grade
4th Grade Comparison
Alaska Natives
Cherokee
98.4%
4TH GRADE
100.0/ 100
METRIC RATING
20th/ 347
METRIC RANK
98.0%
4TH GRADE
99.3/ 100
METRIC RATING
76th/ 347
METRIC RANK
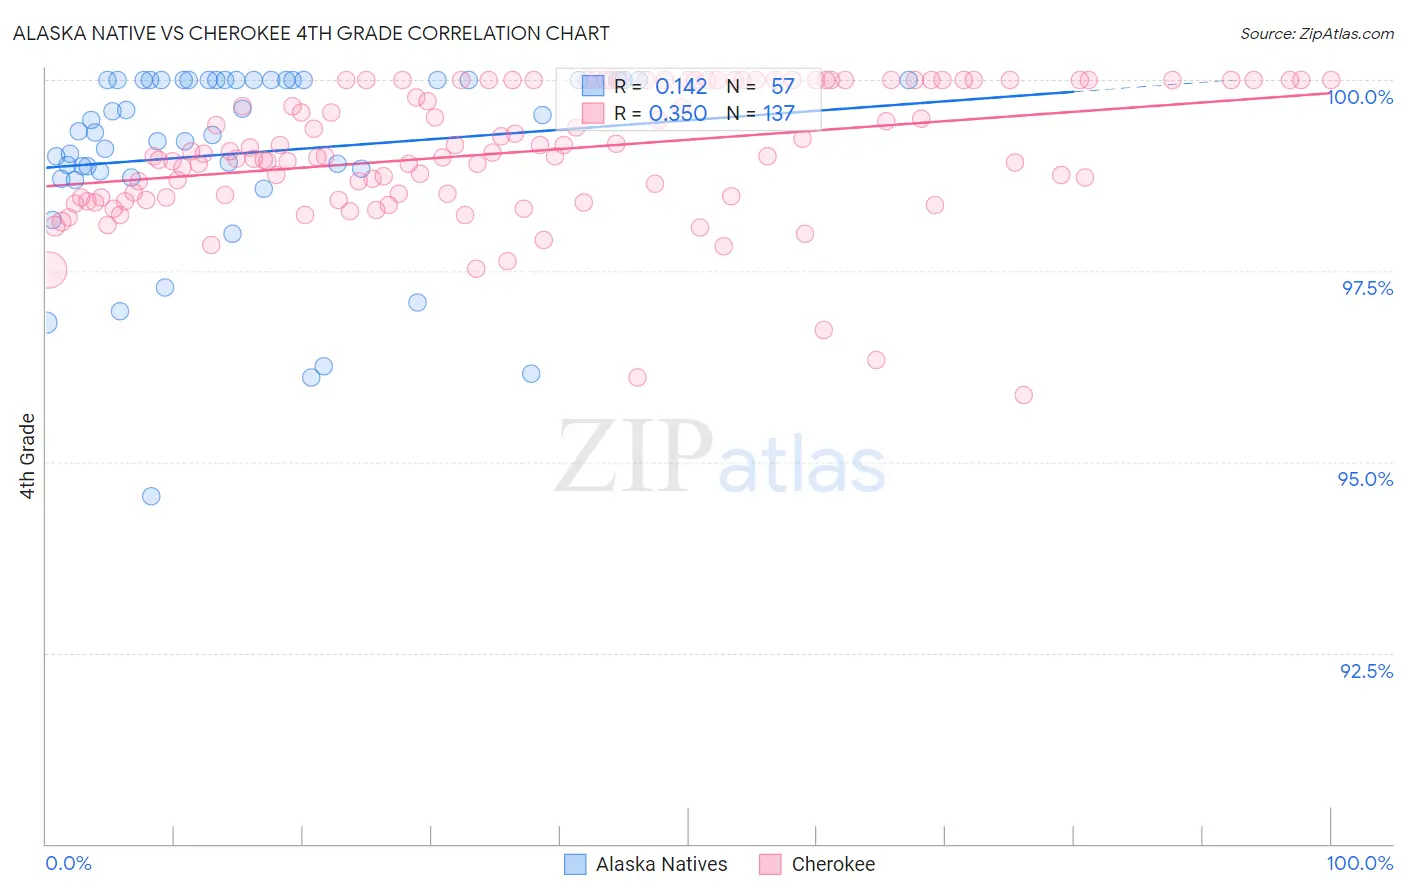
Alaska Native vs Cherokee 4th Grade Correlation Chart
The statistical analysis conducted on geographies consisting of 76,775,774 people shows a poor positive correlation between the proportion of Alaska Natives and percentage of population with at least 4th grade education in the United States with a correlation coefficient (R) of 0.142 and weighted average of 98.4%. Similarly, the statistical analysis conducted on geographies consisting of 493,719,253 people shows a mild positive correlation between the proportion of Cherokee and percentage of population with at least 4th grade education in the United States with a correlation coefficient (R) of 0.350 and weighted average of 98.0%, a difference of 0.39%.
4th Grade Correlation Summary
| Measurement | Alaska Native | Cherokee |
| Minimum | 94.6% | 95.9% |
| Maximum | 100.0% | 100.0% |
| Range | 5.4% | 4.1% |
| Mean | 99.0% | 99.1% |
| Median | 99.3% | 99.0% |
| Interquartile 25% (IQ1) | 98.8% | 98.5% |
| Interquartile 75% (IQ3) | 100.0% | 100.0% |
| Interquartile Range (IQR) | 1.2% | 1.5% |
| Standard Deviation (Sample) | 1.2% | 0.86% |
| Standard Deviation (Population) | 1.2% | 0.86% |
Similar Demographics by 4th Grade
Demographics Similar to Alaska Natives by 4th Grade
In terms of 4th grade, the demographic groups most similar to Alaska Natives are Polish (98.4%, a difference of 0.010%), Irish (98.4%, a difference of 0.010%), Lithuanian (98.3%, a difference of 0.010%), Finnish (98.3%, a difference of 0.010%), and Dutch (98.4%, a difference of 0.020%).
| Demographics | Rating | Rank | 4th Grade |
| Swedes | 100.0 /100 | #13 | Exceptional 98.4% |
| Carpatho Rusyns | 100.0 /100 | #14 | Exceptional 98.4% |
| Dutch | 100.0 /100 | #15 | Exceptional 98.4% |
| Scottish | 100.0 /100 | #16 | Exceptional 98.4% |
| Pennsylvania Germans | 100.0 /100 | #17 | Exceptional 98.4% |
| Poles | 100.0 /100 | #18 | Exceptional 98.4% |
| Irish | 100.0 /100 | #19 | Exceptional 98.4% |
| Alaska Natives | 100.0 /100 | #20 | Exceptional 98.4% |
| Lithuanians | 100.0 /100 | #21 | Exceptional 98.3% |
| Finns | 100.0 /100 | #22 | Exceptional 98.3% |
| Sioux | 100.0 /100 | #23 | Exceptional 98.3% |
| Danes | 100.0 /100 | #24 | Exceptional 98.3% |
| Scotch-Irish | 100.0 /100 | #25 | Exceptional 98.3% |
| Croatians | 100.0 /100 | #26 | Exceptional 98.3% |
| French Canadians | 100.0 /100 | #27 | Exceptional 98.3% |
Demographics Similar to Cherokee by 4th Grade
In terms of 4th grade, the demographic groups most similar to Cherokee are Immigrants from Netherlands (98.0%, a difference of 0.0%), Immigrants from Lithuania (98.0%, a difference of 0.0%), Immigrants from England (98.0%, a difference of 0.0%), Chickasaw (98.0%, a difference of 0.010%), and Ukrainian (98.0%, a difference of 0.010%).
| Demographics | Rating | Rank | 4th Grade |
| Pueblo | 99.6 /100 | #69 | Exceptional 98.0% |
| Immigrants | Austria | 99.6 /100 | #70 | Exceptional 98.0% |
| Lumbee | 99.6 /100 | #71 | Exceptional 98.0% |
| Iranians | 99.4 /100 | #72 | Exceptional 98.0% |
| Macedonians | 99.4 /100 | #73 | Exceptional 98.0% |
| Chickasaw | 99.4 /100 | #74 | Exceptional 98.0% |
| Immigrants | Netherlands | 99.3 /100 | #75 | Exceptional 98.0% |
| Cherokee | 99.3 /100 | #76 | Exceptional 98.0% |
| Immigrants | Lithuania | 99.3 /100 | #77 | Exceptional 98.0% |
| Immigrants | England | 99.3 /100 | #78 | Exceptional 98.0% |
| Ukrainians | 99.2 /100 | #79 | Exceptional 98.0% |
| Osage | 99.2 /100 | #80 | Exceptional 98.0% |
| Immigrants | India | 99.1 /100 | #81 | Exceptional 98.0% |
| Icelanders | 99.1 /100 | #82 | Exceptional 98.0% |
| Immigrants | Belgium | 99.0 /100 | #83 | Exceptional 97.9% |