Alaska Native vs Cherokee Disability Age 35 to 64
COMPARE
Alaska Native
Cherokee
Disability Age 35 to 64
Disability Age 35 to 64 Comparison
Alaska Natives
Cherokee
14.5%
DISABILITY AGE 35 TO 64
0.0/ 100
METRIC RATING
315th/ 347
METRIC RANK
15.5%
DISABILITY AGE 35 TO 64
0.0/ 100
METRIC RATING
329th/ 347
METRIC RANK
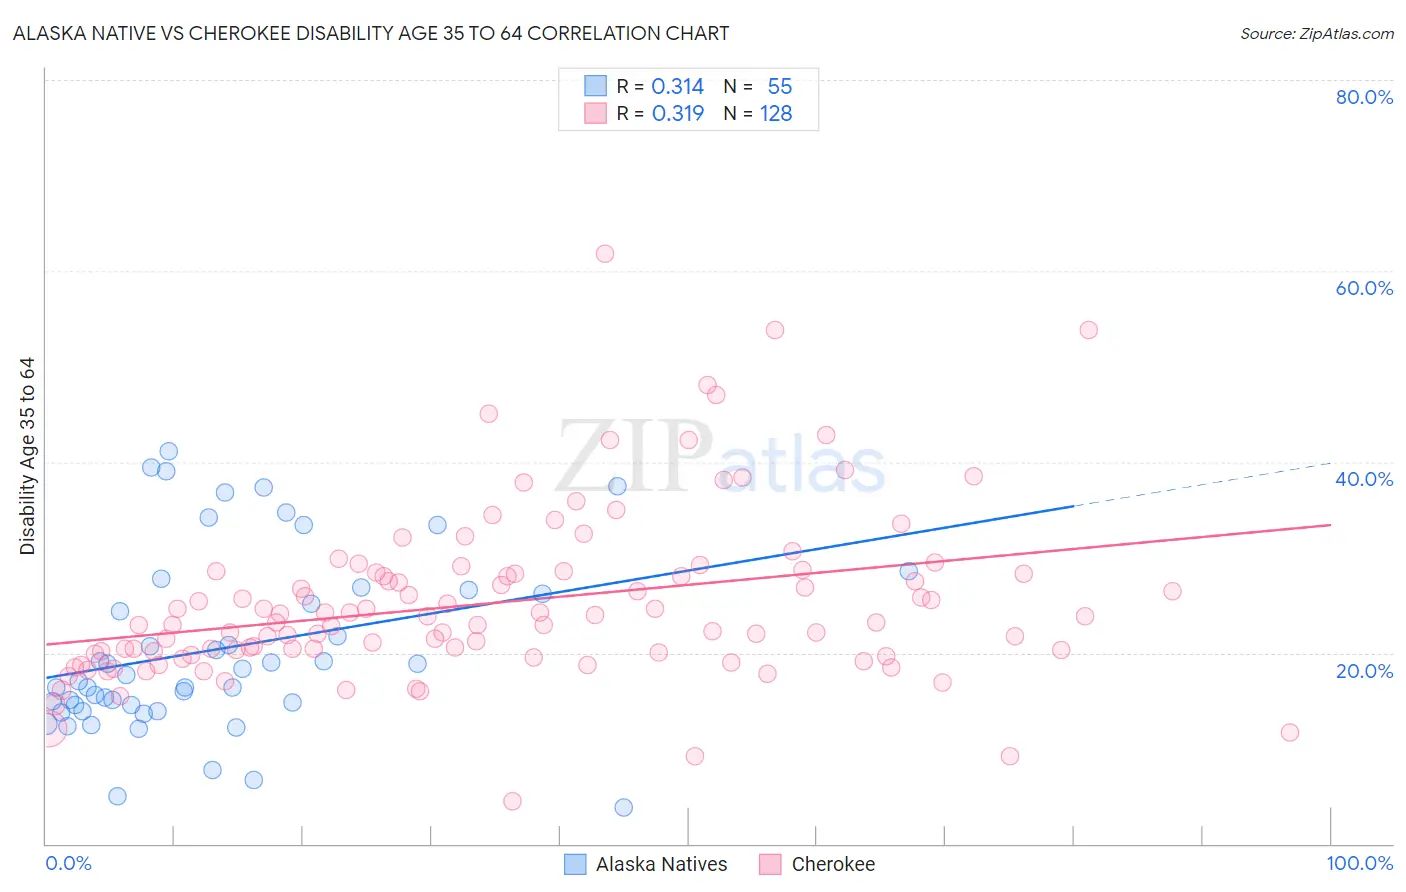
Alaska Native vs Cherokee Disability Age 35 to 64 Correlation Chart
The statistical analysis conducted on geographies consisting of 76,743,337 people shows a mild positive correlation between the proportion of Alaska Natives and percentage of population with a disability between the ages 34 and 64 in the United States with a correlation coefficient (R) of 0.314 and weighted average of 14.5%. Similarly, the statistical analysis conducted on geographies consisting of 493,305,636 people shows a mild positive correlation between the proportion of Cherokee and percentage of population with a disability between the ages 34 and 64 in the United States with a correlation coefficient (R) of 0.319 and weighted average of 15.5%, a difference of 6.9%.
Disability Age 35 to 64 Correlation Summary
| Measurement | Alaska Native | Cherokee |
| Minimum | 3.8% | 4.4% |
| Maximum | 41.2% | 61.8% |
| Range | 37.3% | 57.4% |
| Mean | 20.5% | 25.2% |
| Median | 17.7% | 23.1% |
| Interquartile 25% (IQ1) | 14.5% | 19.9% |
| Interquartile 75% (IQ3) | 26.5% | 28.4% |
| Interquartile Range (IQR) | 12.1% | 8.4% |
| Standard Deviation (Sample) | 9.3% | 9.0% |
| Standard Deviation (Population) | 9.2% | 9.0% |
Demographics Similar to Alaska Natives and Cherokee by Disability Age 35 to 64
In terms of disability age 35 to 64, the demographic groups most similar to Alaska Natives are Shoshone (14.5%, a difference of 0.020%), Osage (14.5%, a difference of 0.19%), Iroquois (14.4%, a difference of 0.77%), Crow (14.6%, a difference of 1.1%), and Ottawa (14.6%, a difference of 1.1%). Similarly, the demographic groups most similar to Cherokee are Navajo (15.5%, a difference of 0.20%), Cajun (15.3%, a difference of 0.75%), Pueblo (15.3%, a difference of 0.93%), Native/Alaskan (15.3%, a difference of 0.95%), and Dutch West Indian (15.6%, a difference of 1.1%).
| Demographics | Rating | Rank | Disability Age 35 to 64 |
| Paiute | 0.0 /100 | #312 | Tragic 14.3% |
| Iroquois | 0.0 /100 | #313 | Tragic 14.4% |
| Shoshone | 0.0 /100 | #314 | Tragic 14.5% |
| Alaska Natives | 0.0 /100 | #315 | Tragic 14.5% |
| Osage | 0.0 /100 | #316 | Tragic 14.5% |
| Crow | 0.0 /100 | #317 | Tragic 14.6% |
| Ottawa | 0.0 /100 | #318 | Tragic 14.6% |
| Immigrants | Cabo Verde | 0.0 /100 | #319 | Tragic 14.7% |
| Blacks/African Americans | 0.0 /100 | #320 | Tragic 14.7% |
| Comanche | 0.0 /100 | #321 | Tragic 14.7% |
| Potawatomi | 0.0 /100 | #322 | Tragic 14.8% |
| Apache | 0.0 /100 | #323 | Tragic 14.9% |
| Chippewa | 0.0 /100 | #324 | Tragic 15.0% |
| Arapaho | 0.0 /100 | #325 | Tragic 15.1% |
| Natives/Alaskans | 0.0 /100 | #326 | Tragic 15.3% |
| Pueblo | 0.0 /100 | #327 | Tragic 15.3% |
| Cajuns | 0.0 /100 | #328 | Tragic 15.3% |
| Cherokee | 0.0 /100 | #329 | Tragic 15.5% |
| Navajo | 0.0 /100 | #330 | Tragic 15.5% |
| Dutch West Indians | 0.0 /100 | #331 | Tragic 15.6% |
| Alaskan Athabascans | 0.0 /100 | #332 | Tragic 15.7% |