African vs Bhutanese 3 or more Vehicles in Household
COMPARE
African
Bhutanese
3 or more Vehicles in Household
3 or more Vehicles in Household Comparison
Africans
Bhutanese
18.2%
3 OR MORE VEHICLES IN HOUSEHOLD
2.7/ 100
METRIC RATING
241st/ 347
METRIC RANK
22.2%
3 OR MORE VEHICLES IN HOUSEHOLD
99.9/ 100
METRIC RATING
61st/ 347
METRIC RANK
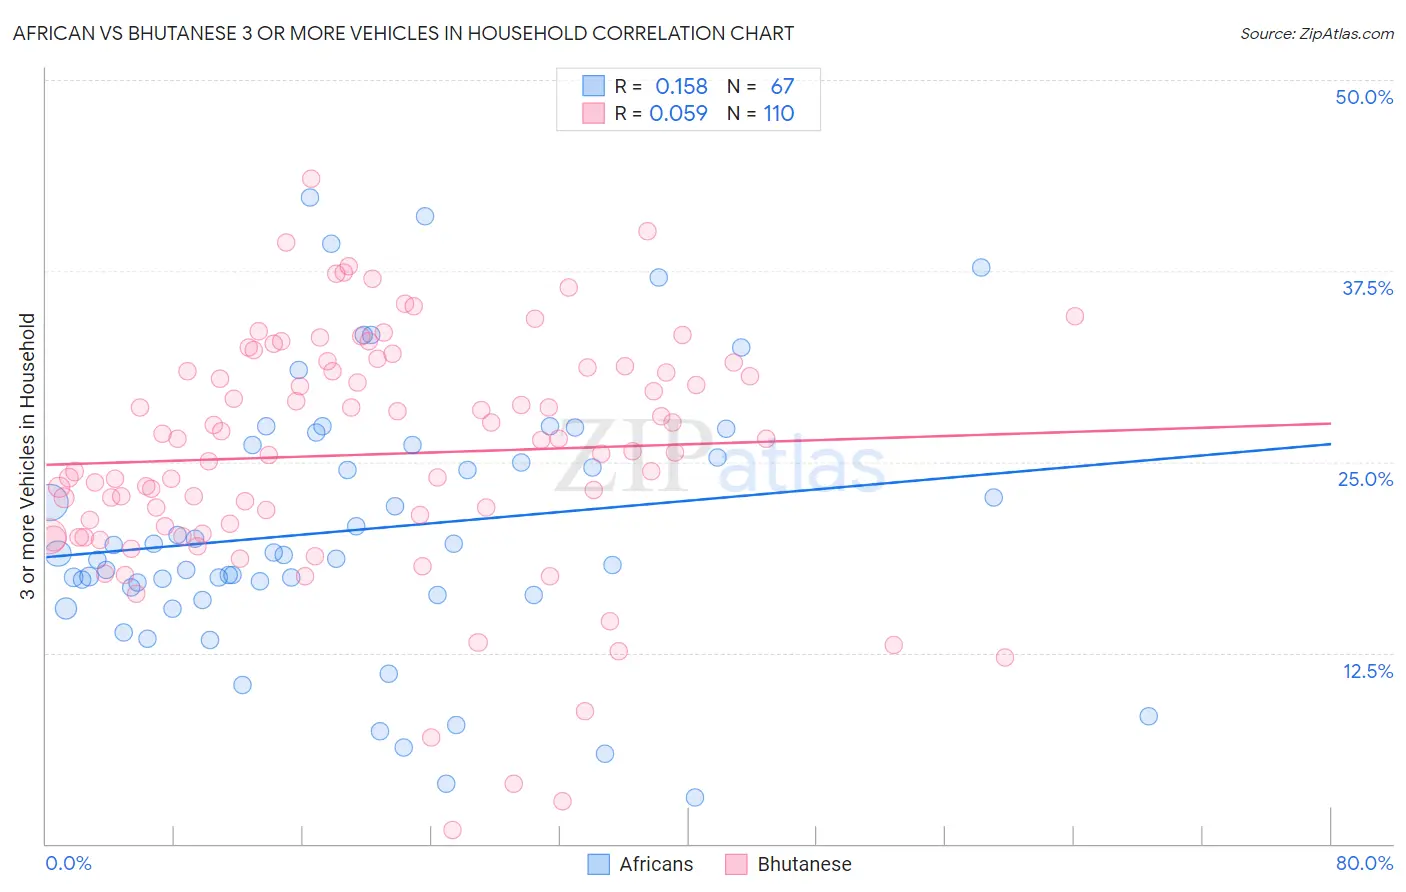
African vs Bhutanese 3 or more Vehicles in Household Correlation Chart
The statistical analysis conducted on geographies consisting of 469,466,855 people shows a poor positive correlation between the proportion of Africans and percentage of households with 3 or more vehicles available in the United States with a correlation coefficient (R) of 0.158 and weighted average of 18.2%. Similarly, the statistical analysis conducted on geographies consisting of 454,966,452 people shows a slight positive correlation between the proportion of Bhutanese and percentage of households with 3 or more vehicles available in the United States with a correlation coefficient (R) of 0.059 and weighted average of 22.2%, a difference of 22.4%.
3 or more Vehicles in Household Correlation Summary
| Measurement | African | Bhutanese |
| Minimum | 3.0% | 0.93% |
| Maximum | 42.3% | 43.5% |
| Range | 39.3% | 42.6% |
| Mean | 20.6% | 25.5% |
| Median | 18.9% | 26.1% |
| Interquartile 25% (IQ1) | 16.3% | 20.7% |
| Interquartile 75% (IQ3) | 26.1% | 31.2% |
| Interquartile Range (IQR) | 9.8% | 10.4% |
| Standard Deviation (Sample) | 8.6% | 7.9% |
| Standard Deviation (Population) | 8.6% | 7.9% |
Similar Demographics by 3 or more Vehicles in Household
Demographics Similar to Africans by 3 or more Vehicles in Household
In terms of 3 or more vehicles in household, the demographic groups most similar to Africans are Hopi (18.2%, a difference of 0.11%), Immigrants from China (18.2%, a difference of 0.20%), Immigrants from Europe (18.1%, a difference of 0.23%), Immigrants from Middle Africa (18.2%, a difference of 0.32%), and Immigrants from Honduras (18.2%, a difference of 0.33%).
| Demographics | Rating | Rank | 3 or more Vehicles in Household |
| Immigrants | North Macedonia | 4.4 /100 | #234 | Tragic 18.4% |
| Sierra Leoneans | 3.9 /100 | #235 | Tragic 18.3% |
| Immigrants | Malaysia | 3.6 /100 | #236 | Tragic 18.3% |
| Indonesians | 3.5 /100 | #237 | Tragic 18.3% |
| Immigrants | Honduras | 3.1 /100 | #238 | Tragic 18.2% |
| Immigrants | Middle Africa | 3.1 /100 | #239 | Tragic 18.2% |
| Immigrants | China | 2.9 /100 | #240 | Tragic 18.2% |
| Africans | 2.7 /100 | #241 | Tragic 18.2% |
| Hopi | 2.5 /100 | #242 | Tragic 18.2% |
| Immigrants | Europe | 2.4 /100 | #243 | Tragic 18.1% |
| Mongolians | 2.3 /100 | #244 | Tragic 18.1% |
| Immigrants | Belize | 2.1 /100 | #245 | Tragic 18.1% |
| Immigrants | Australia | 2.0 /100 | #246 | Tragic 18.1% |
| Carpatho Rusyns | 1.9 /100 | #247 | Tragic 18.0% |
| Immigrants | Eastern Africa | 1.8 /100 | #248 | Tragic 18.0% |
Demographics Similar to Bhutanese by 3 or more Vehicles in Household
In terms of 3 or more vehicles in household, the demographic groups most similar to Bhutanese are Fijian (22.2%, a difference of 0.040%), Finnish (22.3%, a difference of 0.16%), Chickasaw (22.2%, a difference of 0.20%), Navajo (22.3%, a difference of 0.24%), and Spaniard (22.3%, a difference of 0.30%).
| Demographics | Rating | Rank | 3 or more Vehicles in Household |
| Crow | 100.0 /100 | #54 | Exceptional 22.5% |
| Immigrants | Laos | 100.0 /100 | #55 | Exceptional 22.4% |
| Hispanics or Latinos | 100.0 /100 | #56 | Exceptional 22.4% |
| Pennsylvania Germans | 100.0 /100 | #57 | Exceptional 22.3% |
| Spaniards | 100.0 /100 | #58 | Exceptional 22.3% |
| Navajo | 100.0 /100 | #59 | Exceptional 22.3% |
| Finns | 99.9 /100 | #60 | Exceptional 22.3% |
| Bhutanese | 99.9 /100 | #61 | Exceptional 22.2% |
| Fijians | 99.9 /100 | #62 | Exceptional 22.2% |
| Chickasaw | 99.9 /100 | #63 | Exceptional 22.2% |
| Immigrants | Taiwan | 99.9 /100 | #64 | Exceptional 22.1% |
| Pima | 99.9 /100 | #65 | Exceptional 22.0% |
| Northern Europeans | 99.9 /100 | #66 | Exceptional 22.0% |
| Alaskan Athabascans | 99.9 /100 | #67 | Exceptional 21.9% |
| British | 99.9 /100 | #68 | Exceptional 21.9% |